- Since, Vmax is achieved at infinite substrate concentration, it is impossible to estimate Vmax and hence Km from a hyperbolic plot.
- Because of this difficulty, the Michaelis–Menten equation was transformed into an equation for a straight line by Lineweaver and Burk.
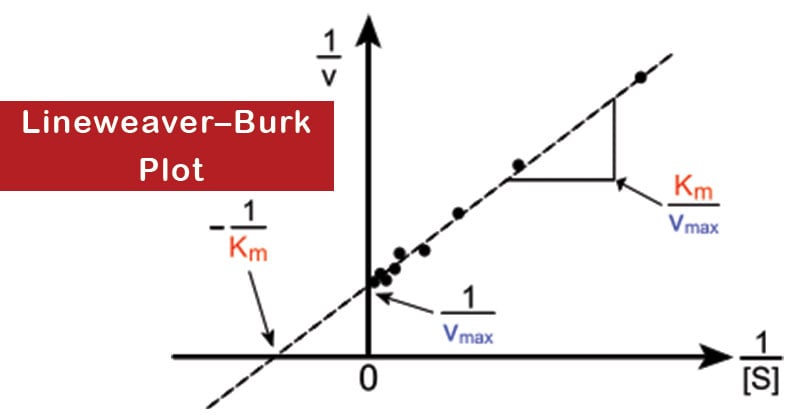
- The Lineweaver–Burk plot (or double reciprocal plot) is a graphical representation of the Lineweaver–Burk equation of enzyme kinetics, described by Hans Lineweaver and Dean Burk in 1934.
- This plot is a derivation of the Michaelis–Menten equation and is represented as:

Interesting Science Videos
where V is the reaction velocity (the reaction rate), Km is the Michaelis–Menten constant, Vmax is the maximum reaction velocity, and [S] is the substrate concentration.
- It gives a straight line, with the intercept on the y-axis equal to 1/Vmax, and the intercept on the x-axis equal to Km/Vmax. The slope of the line is equal to Km/Vmax.
- Vmax and Km can be determined experimentally by measuring V0 at different substrate concentrations. Then a double reciprocal or Lineweaver–Burk plot of 1/V0 against 1/[S] is made.

- Reversible enzyme inhibitors can be classified as either competitive or noncompetitive, and can be distinguished via a Lineweaver–Burk plot.
- It is a useful way of determining how an inhibitor binds to an enzyme.
- Competitive inhibition can be recognized by using a Lineweaver–Burk plot if V0 is measured at different substrate concentrations in the presence of a fixed concentration of inhibitor.
- A competitive inhibitor increases the slope of the line on the Lineweaver–Burk plot, and alters the intercept on the x-axis (since Km is increased), but leaves the intercept on the y- axis unchanged (since Vmax remains constant).
- Noncompetitive inhibition can also be recognized on a Lineweaver–Burk plot since it increases the slope of the experimental line, and alters the intercept on the y-axis (since Vmax is decreased), but leaves the intercept on the x-axis unchanged (since Km remains constant).
Uses of Lineweaver–Burk Plot
- Used to determine important terms in enzyme kinetics, such as Kmand Vmax, before the wide availability of powerful computers and non-linear regression software.
- Gives a quick, visual impression of the different forms of enzyme inhibition.
References
- David Hames and Nigel Hooper (2005). Biochemistry. Third ed. Taylor & Francis Group: New York.
- Smith, C. M., Marks, A. D., Lieberman, M. A., Marks, D. B., & Marks, D. B. (2005). Marks’ basic medical biochemistry: A clinical approach. Philadelphia: Lippincott Williams & Wilkins.
- https://en.wikipedia.org/wiki/Lineweaver%E2%80%93Burk_plot
