- A major role of proteins is to serve as enzymes, the catalysts of biochemical reactions.
- They do so by reducing the Gibbs free energy of activation, ΔG, making it easier for the reaction to reach its transition state.
- The rate (v) of many enzyme-catalyzed reactions can be described by the Michaelis–Menten equation.
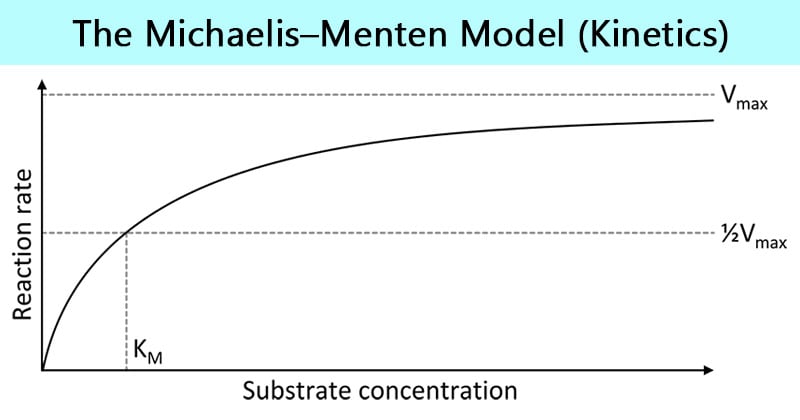
- For enzymes that exhibit Michaelis–Menten kinetics, plots of velocity-versus-substrate concentration are hyperbolic.

Interesting Science Videos
Enzyme velocity
- The rate of an enzyme-catalyzed reaction is often called its velocity.
- Enzyme velocities are normally reported as values at time zero (initial velocity, symbol Vo; μmol min-1).
- This is because the rate is fastest at the point where no product is yet present as the substrate concentration is greatest before any substrate has been transformed to product.
- A typical plot of product formed against time for an enzyme-catalyzed reaction shows an initial period of rapid product formation which gives the linear portion of the plot.
- This is followed by a slowing down of the enzyme rate as substrate is used up and/or as the enzyme loses activity.
- V0 is obtained by drawing a straight line through the linear part of the curve, starting at the zero time-point. The slope of this straight line is equal to V0.
Substrate and enzyme concentration
- The normal pattern of dependence of enzyme rate on substrate concentration ([S]) is that at low substrate concentrations a doubling of [S] will lead to a doubling of the initial velocity (V0).
- However, at higher substrate concentrations the enzyme becomes saturated and further increases in [S] lead to very small changes in V0.
- This occurs because at saturating substrate concentrations, all of the enzyme molecules have bound substrate.
- The overall enzyme rate is now dependent on the rate at which the product can dissociate from the enzyme, and adding further substrate will not affect this. The shape of the resulting graph when V0 is plotted against [S] is called a hyperbolic curve.
- In situations where the substrate concentration is saturating, a doubling of the enzyme concentration will lead to a doubling of V0. This gives a straight line graph when V0 is plotted against enzyme concentration.
The Michaelis–Menten model
- Michaelis–Menten kinetics is one of the best-known models of enzyme kinetics.
- It is named after German biochemist Leonor Michaelis and Canadian physician Maud Menten.
- The model takes the form of an equation describing the rate of enzymatic reactions, by relating reaction rate v (rate of formation of product [P]) to [S], the concentration of a substrate S.
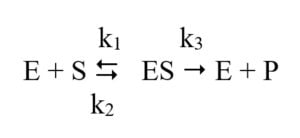
- The Michaelis–Menten model uses the following concept of enzyme catalysis:

- The enzyme (E), combines with its substrate (S) to form an enzyme–substrate complex (ES).
- The ES complex can dissociate again to form E + S, or can proceed chemically to form E and the product P.
- The rate constants k1, k2 and k3 describe the rates associated with each step of the catalytic process.
- It is assumed that there is no significant rate for the backward reaction of enzyme and product (E + P) being converted to ES complex.
- [ES] remains approximately constant until nearly all the substrate is used, hence the rate of synthesis of ES equals its rate of consumption over most of the course of the reaction; that is, [ES] maintains a steady state.
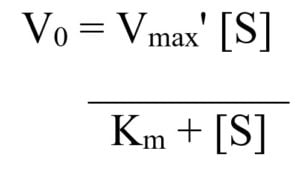
- From this concept, the Michaelis–Menten equation was derived:
The Michaelis–Menten equation:

where, Km = (k2 + k3)/k1 and Vmax is the maximum velocity.
The Michaelis constant, Km, is equal to the sum of the rates of breakdown of the enzyme–substrate complex over its rate of formation, and is a measure of the affinity of an enzyme for its substrate.
- The rate of formation of products (the velocity of the reaction) is related to the concentration of the enzyme–substrate complex:
v = k3[ES]
Vmax is reached when the entire enzyme is in the enzyme–substrate complex.
- Km is the substrate concentration at which v = 1/2 Vmax.
When [S] = Km, substitution of Km for [S] in the Michaelis–Menten equation yields v = 1/2 Vmax.
- When the velocity is plotted versus [S], a hyperbolic curve is produced.
References
- David Hames and Nigel Hooper (2005). Biochemistry. Third ed. Taylor & Francis Group: New York.
- Smith, C. M., Marks, A. D., Lieberman, M. A., Marks, D. B., & Marks, D. B. (2005). Marks’ basic medical biochemistry: A clinical approach. Philadelphia: Lippincott Williams & Wilkins.

The are so good for the students.
Excellent notes