
DNA quantification is a fundamental step in molecular biology, ensuring that downstream applications such as PCR, qPCR, sequencing, cloning, and restriction digestion are performed with optimal template input. Among the available quantification techniques, microvolume UV-Vis spectrophotometry with the NanoDrop has become widely adopted in research laboratories for its speed, minimal sample requirements, and ease of use.
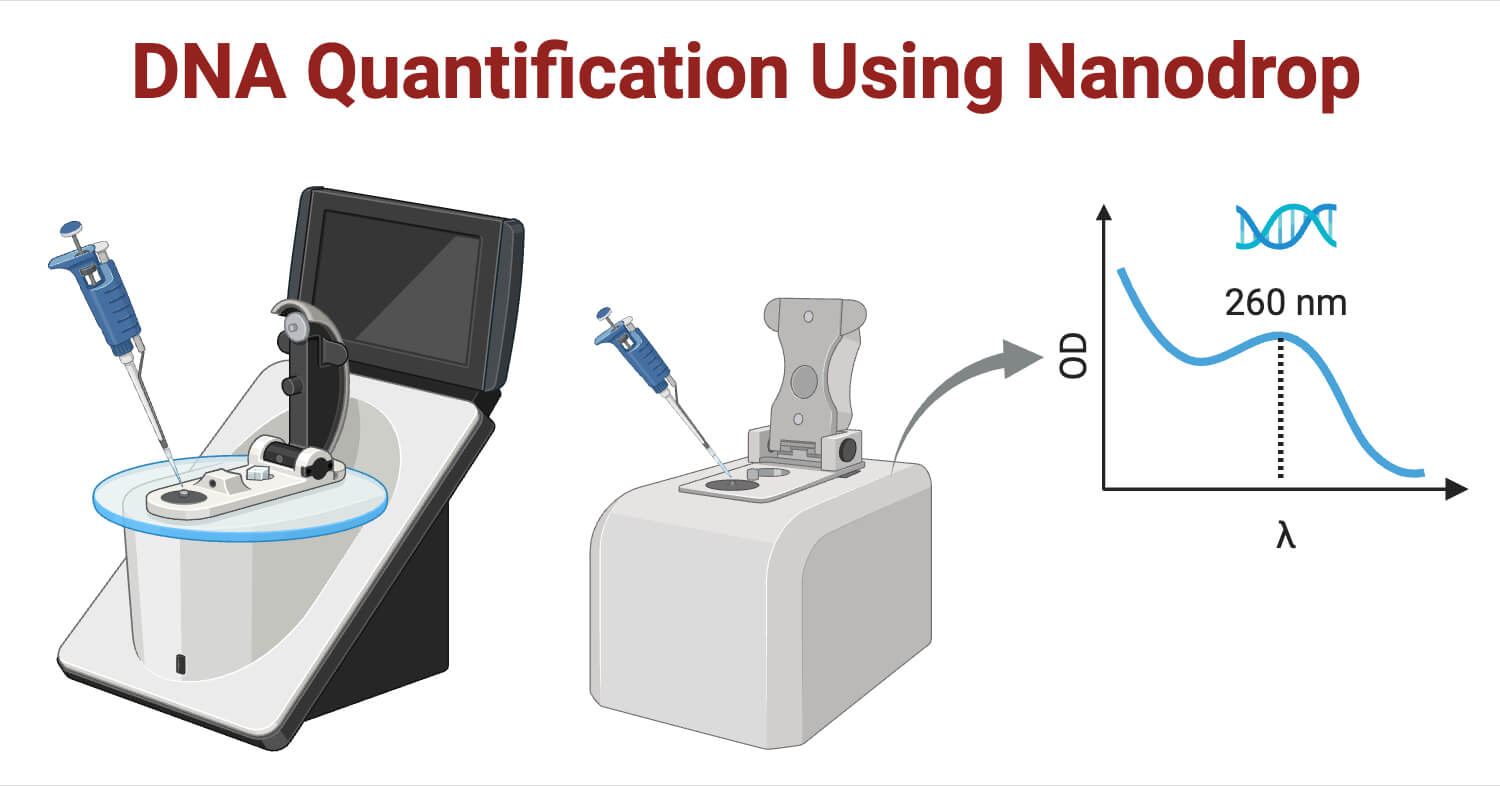
The NanoDrop spectrophotometer enables direct measurement of nucleic acid concentration using as little as 1-2 µL of sample. According to García-Alegría et al. (2020), the method can provide reliable quantification when properly validated using standard reference materials, rat DNA, and human DNA. Their study demonstrated that spectrophotometric quantification is reproducible and linear across a defined concentration range when good laboratory practices are followed.
Recent comparative research has highlighted that spectrophotometric methods, including NanoDrop, may overestimate DNA concentration in the presence of contaminants. Versmessen et al. (2024) compared the NanoDrop, DeNovix, and Qubit platforms and found that spectrophotometric systems are particularly sensitive to impurities that absorb at wavelengths similar to those of DNA. Thus, while NanoDrop remains convenient and rapid, interpretation of results must include careful evaluation of purity ratios.
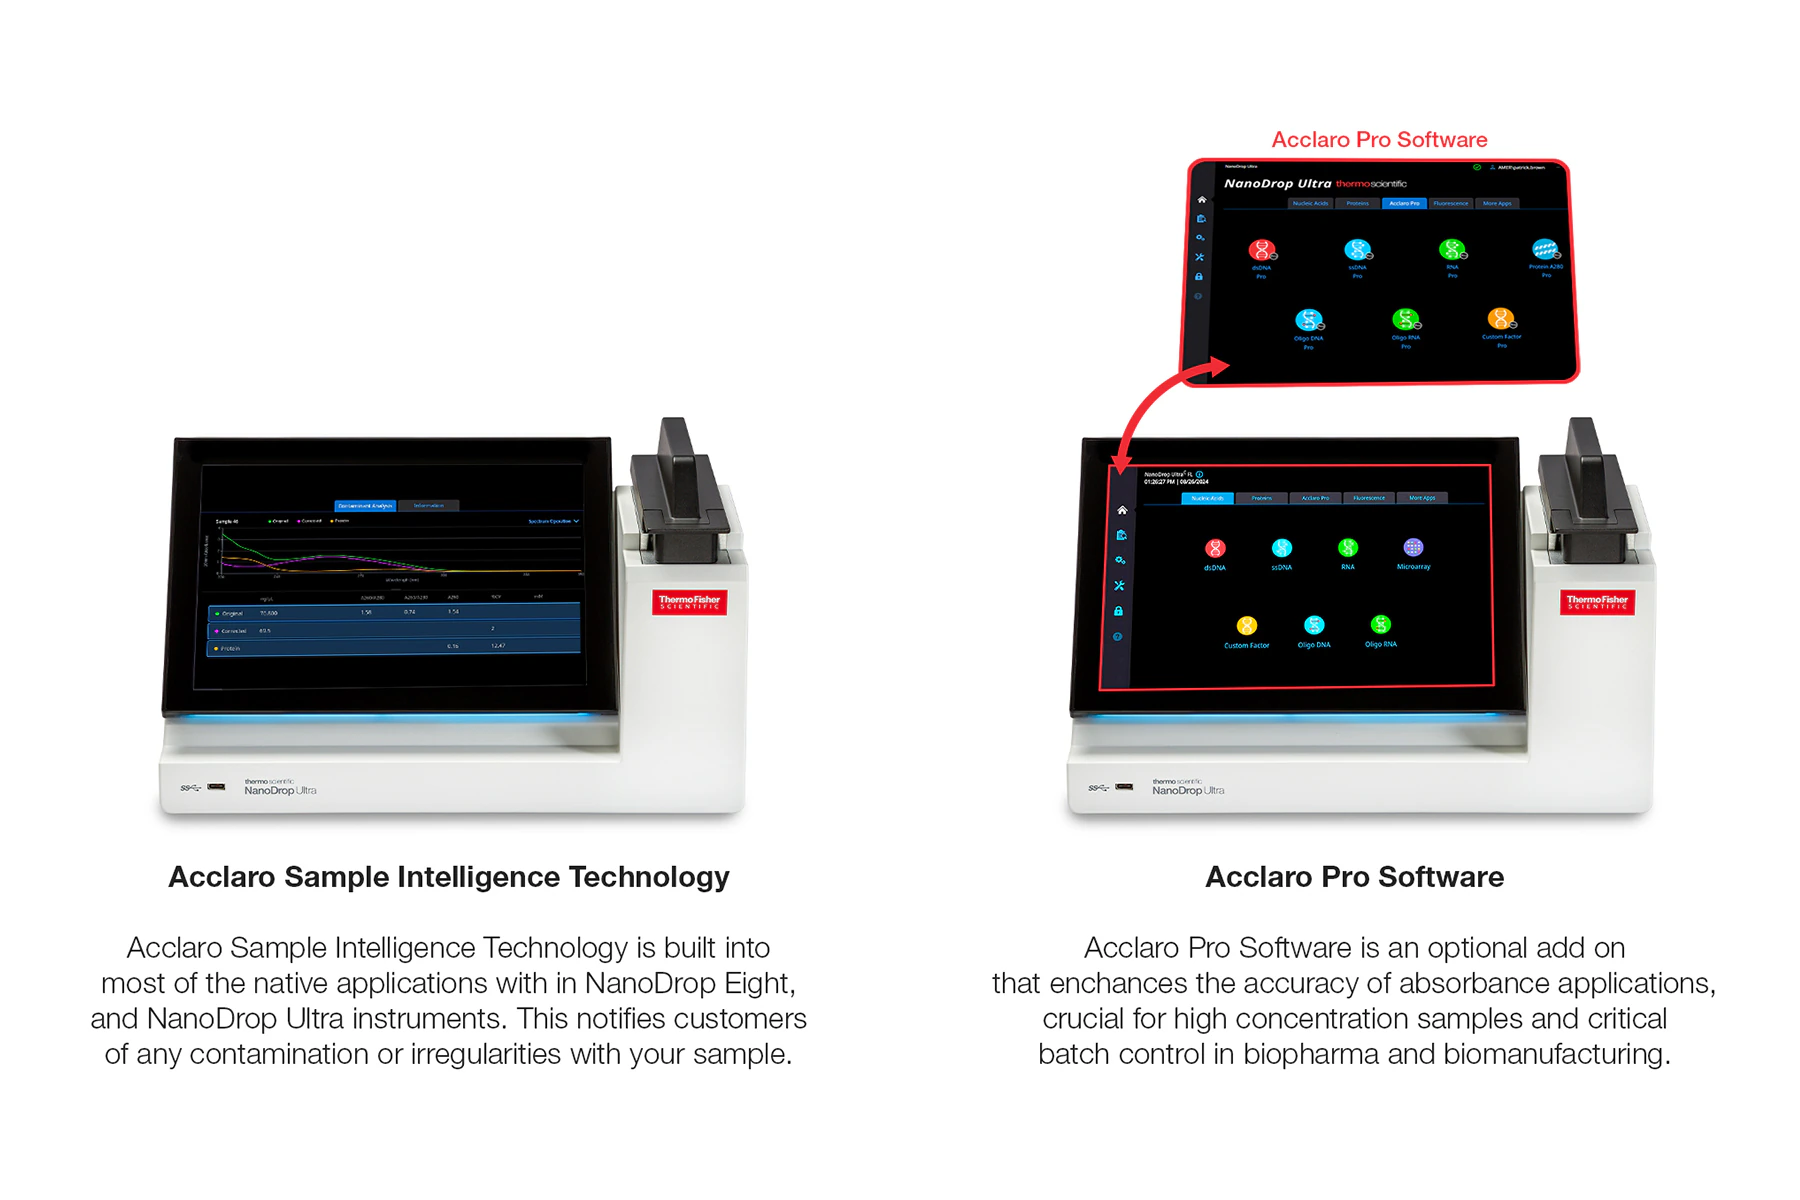
Educational resources such as Bitesize Bio (2025a, 2025b) emphasize that reproducibility depends heavily on proper blanking, pedestal cleanliness, and pipetting accuracy. The Thermo Fisher Scientific application guidelines further describe NanoDrop as a robust tool for nucleic acid quantification and quality assessment through absorbance ratio analysis.
Overall, NanoDrop-based DNA quantification represents a balance between efficiency and analytical caution, making it an essential tool in undergraduate and research laboratories.
Key Reagents of DNA Quantification Using Nanodrop
Although NanoDrop measurement does not require chemical reactions, certain reagents and materials are essential for accurate quantification.
| Reagent | Typical Concentration / Amount | Purpose |
| DNA sample | 1–2 µL | Sample to be quantified |
| Elution buffer (e.g., TE buffer) | Same buffer used for DNA storage | Blank/reference measurement |
| Nuclease-free water | 1–2 µL | Alternative blank or dilution medium |
| 70% Ethanol | As needed | Cleaning pedestal surfaces |
| Lint-free laboratory wipes | As needed | Drying and cleaning pedestals |
García-Alegría et al. (2020) stress the importance of using the same buffer for blanking as was used to elute the DNA. This prevents systematic measurement bias. Thermo Fisher Scientific application notes similarly recommend cleaning pedestals between each measurement to avoid carryover effects.
Principle of DNA Quantification Using Nanodrop
The NanoDrop spectrophotometer quantifies DNA using ultraviolet (UV) absorbance spectrophotometry, a method based on the intrinsic light-absorbing properties of nucleic acids. DNA molecules contain nitrogenous bases, adenine, thymine, cytosine, and guanine, which possess aromatic ring structures. These rings contain conjugated double bonds that strongly absorb ultraviolet light, particularly at a wavelength of 260 nm, making this wavelength ideal for nucleic acid detection and quantification (García-Alegría et al., 2020).
UV Absorbance and DNA Detection
When UV light passes through a DNA sample, part of the light is absorbed by the nucleic acid molecules, and the remaining light passes through. The spectrophotometer measures the amount of light absorbed, known as absorbance. The greater the DNA concentration, the more UV light is absorbed at 260 nm. This relationship between absorbance and concentration forms the basis of DNA quantification.
Unlike conventional spectrophotometers that use fixed path length cuvettes (usually 10 mm), the NanoDrop uses a microvolume pedestal system that forms a liquid column between two optical surfaces. This design allows accurate measurement of extremely small sample volumes (1–2 µL) without dilution or cuvettes. The instrument automatically adjusts the path length depending on the sample concentration, typically ranging between 0.05 mm and 1 mm, ensuring accurate measurement across a wide concentration range (Thermo Fisher Scientific, Applications).
Beer-Lambert Law and DNA Quantification:
DNA quantification using NanoDrop follows the Beer–Lambert law, which states:
A = ε⋅c⋅l
Where:
A = absorbance
ε = molar extinction coefficient
c = concentration
l = path length
For double-stranded DNA, an absorbance of 1.0 at 260 nm corresponds to approximately 50 µg/mL. The NanoDrop instrument dynamically adjusts the path length (typically between 0.05–1 mm) to accommodate varying sample concentrations without dilution (Thermo Fisher Scientific, Applications).
Purity is assessed using absorbance ratios:
A260/A280 ratio: Evaluates protein contamination. Pure DNA typically ranges between 1.8–2.0 (García-Alegría et al., 2020).
A260/A230 ratio: Indicates contamination from salts, phenol, or carbohydrates. Ideal values are generally between 2.0–2.2.
Versmessen et al. (2024) demonstrated that impurities such as proteins or residual extraction reagents can significantly distort absorbance readings, leading to overestimation of DNA concentration. Concentration and purity must always be interpreted together.
Steps / Protocol of DNA Quantification Using Nanodrop
Instrument Initialization:
- Turn on the NanoDrop spectrophotometer and select the dsDNA measurement mode.
Pedestal Cleaning:
- Clean both upper and lower pedestals with lint-free tissue and 70% ethanol. Allow to dry.
Blanking:
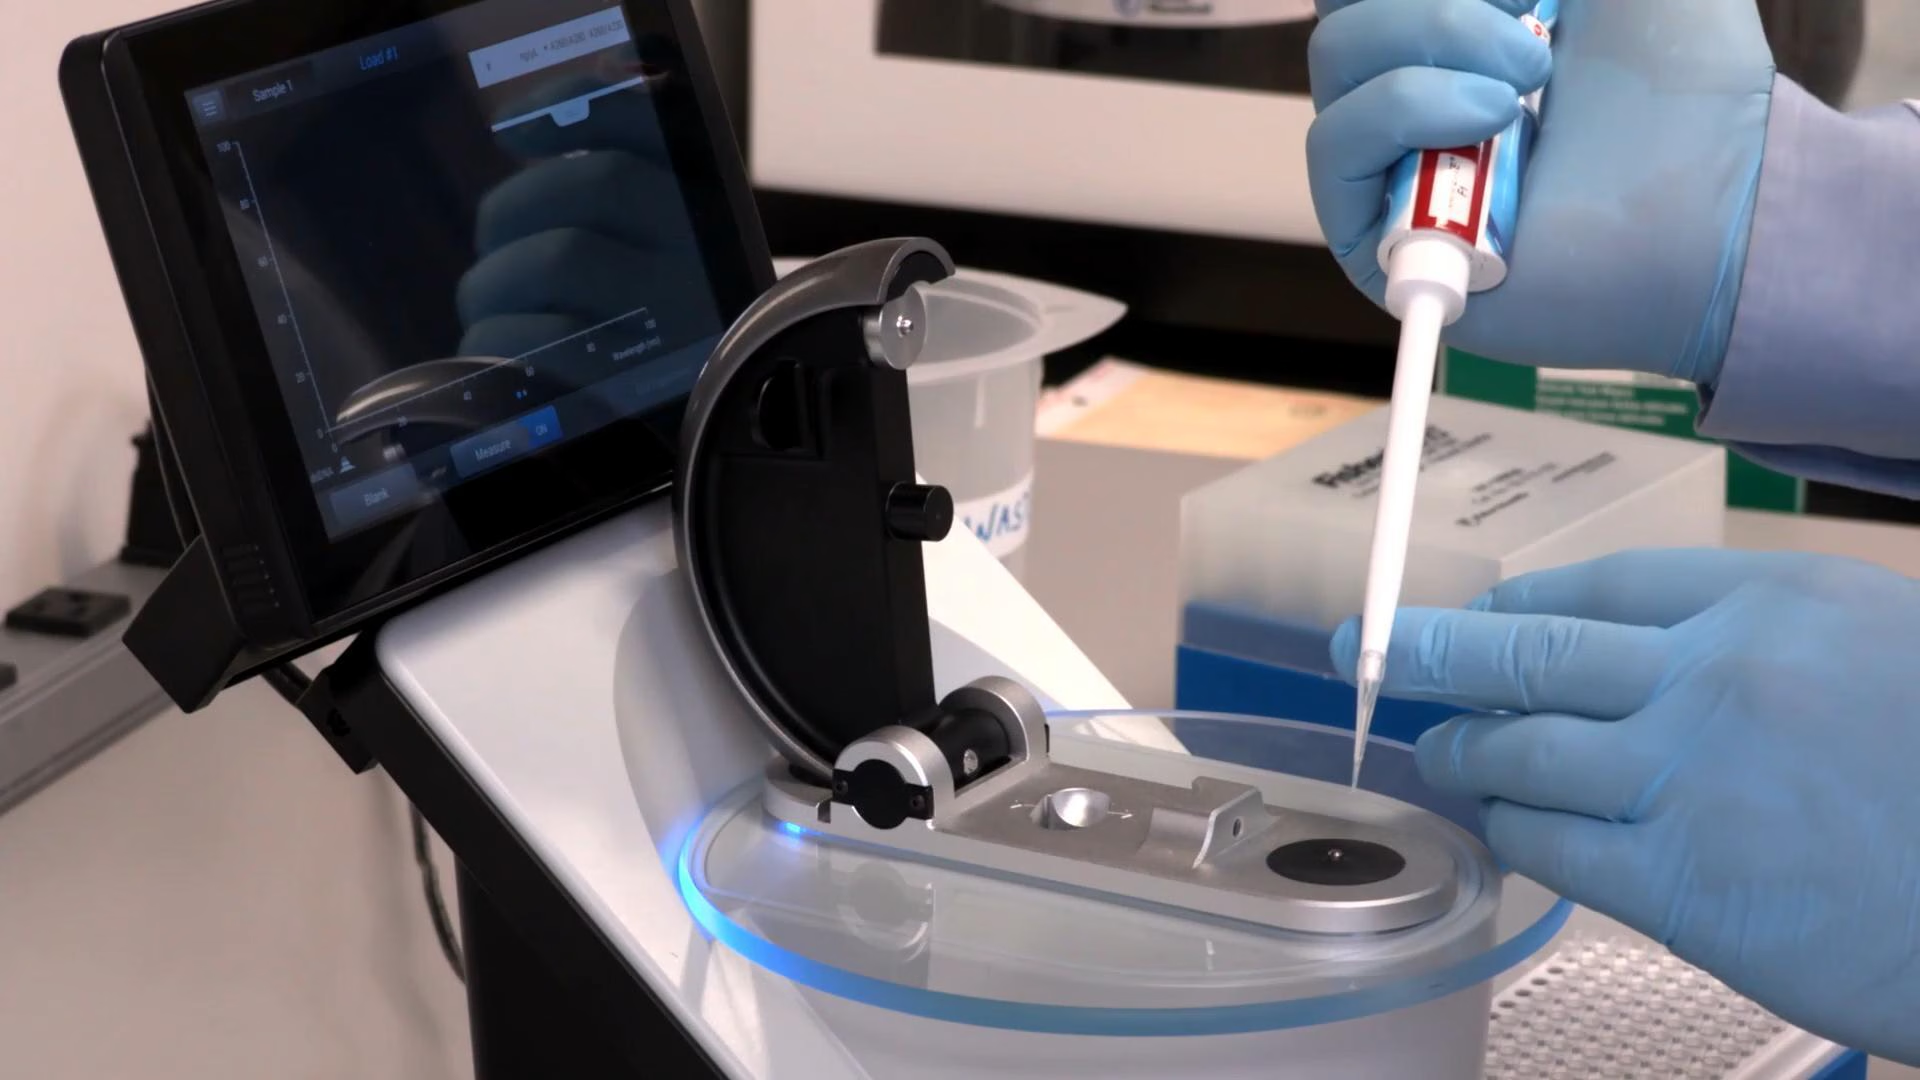
- Pipette 1-2 µL of the DNA elution buffer (same buffer used for sample storage) onto the lower pedestal.
- Lower the arm and select “Blank.”
- Wipe clean after blanking.
Sample Loading:
- Mix the DNA sample gently without vortexing unless necessary.
- Pipette 1–2 µL onto the lower pedestal.
- Lower the arm carefully.
Measurement:
- Click “Measure.”
- The instrument records absorbance at 260 nm, 280 nm, and 230 nm.
Recording Results:
- Note concentration (ng/µL) and purity ratios (A260/A280 and A260/A230).
Repeatability Check:
- Measure each sample at least twice for reproducibility (Bitesize Bio, 2025a).
Final Cleaning:
- Clean pedestals thoroughly after use.
García-Alegría et al. (2020) recommend replicate measurements to confirm linearity and reproducibility.
Observations and Results in Nanodrop
Typical output includes:
- DNA concentration in ng/µL
- A260/A280 ratio
- A260/A230 ratio
- Full absorbance spectrum (220–350 nm)
According to García-Alegría et al. (2020), properly prepared DNA samples show consistent concentration values across replicates and acceptable purity ratios. Versmessen et al. (2024) observed that samples with bacterial extraction contaminants showed altered A260/A230 ratios and inflated concentration readings compared to fluorescence-based methods.
Spectral curves should demonstrate:
- Peak at 260 nm
- Smooth decline toward 280 nm
- Minimal abnormal peaks at 230 nm
Modifications of DNA Quantification Using Nanodrop
- Replicate Measurements: Performing duplicate or triplicate readings improves reliability and identifies pipetting errors (Bitesize Bio, 2025a).
- Sample Dilution for Highly Concentrated DNA: Extremely concentrated samples may benefit from dilution to remain within the linear range (García-Alegría et al., 2020).
- Use of Alternative Quantification Methods for Low Concentrations: For highly dilute samples, fluorescence-based quantification may be preferred (Versmessen et al., 2024).
- Strict Pedestal Cleaning Between Samples: Prevents cross-contamination and carryover (Bitesize Bio, 2025a).
- Validation with Standard Reference Material: García-Alegría et al. (2020) validated NanoDrop using reference DNA to confirm accuracy.
Troubleshooting of DNA Quantification Using Nanodrop
| Problem | Likely Cause | Solution |
| Inconsistent readings | Poor pedestal cleaning | Clean thoroughly with ethanol and wipe dry |
| Low A260/A280 ratio | Protein contamination | Improve DNA purification |
| Low A260/A230 ratio | Salt or phenol contamination | Re-purify sample |
| Unexpectedly high concentration | Contaminants absorbing at 260 nm | Confirm with the fluorescence method |
| Poor reproducibility | Pipetting error or bubbles | Use a calibrated pipette; avoid air bubbles |
Bitesize Bio (2025a) emphasizes that pedestal cleanliness and proper blanking are the most common sources of reproducibility problems.
Quality Assessment of the Isolated cDNA
- A260/A280 Ratio: Indicates protein contamination; ideal ~1.8 (García-Alegría et al., 2020).
- A260/A230 Ratio: Detects organic compounds and salts; ideal 2.0–2.2.
- Absorbance Spectrum Shape: Smooth curve confirms absence of abnormal absorbing contaminants.
- Replicate Consistency: Similar readings across measurements indicate technical reliability.
- Comparison with Alternative Methods: As shown by Versmessen et al. (2024), cross-validation enhances confidence.
Safety Tips and Precautions of DNA Quantification Using Nanodrop
- Wear Gloves Throughout: Prevents contamination from skin oils, sweat, nucleases, and environmental DNA, which may affect absorbance readings. Gloves also protect users from exposure to chemical residues, cleaning agents, and potentially hazardous biological samples during measurement.
- Avoid Cross-Contamination: Always use fresh pipette tips between samples and avoid touching the pedestal with contaminated tips. Even trace carryover from previous samples can alter absorbance values, affecting both concentration accuracy and purity assessment results.
- Work on Clean Surface: Perform measurements on a clean, organized bench wiped with 70% ethanol or covered with fresh bench paper. A clean workspace minimizes environmental contamination from dust, aerosols, and residual biological material, ensuring reliable measurements.
- Perform Careful Pipetting: Pipette slowly and precisely to avoid introducing air bubbles, which interfere with light transmission. Do not allow the pipette tip to touch the pedestal surface, as scratching or contamination can permanently affect instrument accuracy.
- Do Not Vortex Unless Necessary: Excessive vortexing may shear genomic DNA into smaller fragments, potentially affecting downstream applications. Instead, gently mix samples by pipetting to preserve DNA integrity and maintain consistent, accurate NanoDrop measurement results.
Applications of DNA Quantification Using Nanodrop
- PCR and qPCR Preparation: Accurate DNA quantification ensures optimal template input, which improves amplification efficiency, reduces variability, and prevents reaction inhibition caused by excessive DNA or contaminants in sensitive amplification reactions.
- Next-Generation Sequencing Library Preparation: NanoDrop allows rapid estimation of DNA concentration before sequencing library preparation. This ensures proper normalization of samples, improves sequencing efficiency, and helps achieve consistent and reliable sequencing results.
- Cloning Experiments: Determining the concentration of insert and vector DNA ensures proper molar ratios during ligation, increasing cloning efficiency and reducing the likelihood of failed or inefficient recombinant DNA formation.
- Restriction Digestion: Accurate DNA concentration allows correct enzyme-to-DNA ratio selection, ensuring complete digestion while preventing enzyme wastage or incomplete digestion, which may compromise downstream experimental outcomes.
- Academic Teaching Laboratories: NanoDrop provides students with rapid and hands-on experience in nucleic acid quantification, helping them understand spectrophotometry principles, DNA purity assessment, and preparation for downstream molecular biology applications.
Advantages of DNA Quantification Using Nanodrop
- Minimal Sample Volume Required: Only 1–2 µL of DNA is needed, preserving valuable samples. This is especially useful when working with limited clinical, environmental, or experimental DNA samples.
- Rapid Measurement: Concentration and purity results are obtained within seconds, allowing efficient processing of multiple samples and improving laboratory workflow efficiency compared to more time-consuming quantification methods.
- No Cuvettes Required: The microvolume pedestal design eliminates the need for cuvettes, reducing consumable costs, minimizing sample handling errors, and simplifying the quantification procedure for routine laboratory use.
- Simultaneous Purity Assessment: The instrument measures absorbance at multiple wavelengths, providing purity ratios that help detect contamination from proteins, salts, and organic compounds affecting downstream experimental performance.
- Cost-Effective per Sample: NanoDrop quantification does not require expensive reagents, dyes, or consumables, making it economically efficient for routine DNA quantification in teaching and research laboratories.
Limitations of DNA Quantification Using Nanodrop
- Overestimation in the Presence of Contaminants: Molecules such as RNA, proteins, phenol, or salts also absorb UV light, which may increase absorbance readings and result in overestimated DNA concentration values.
- Lower Sensitivity Compared to Fluorescent Methods: NanoDrop is less accurate for very low DNA concentrations, as weak absorbance signals may fall near detection limits, reducing reliability for dilute or precious samples.
- Dependent on Proper Technique: Improper blanking, poor pedestal cleaning, or inaccurate pipetting can significantly affect measurement accuracy, emphasizing the importance of careful laboratory technique and instrument maintenance.
- Cannot Differentiate DNA from RNA Without Additional Steps: Since both DNA and RNA absorb at 260 nm, NanoDrop measures total nucleic acids unless additional purification or enzymatic treatment removes unwanted RNA contamination.
- Impurity Detection Limited to Absorbance Patterns: Although purity ratios indicate contamination presence, the instrument cannot identify specific contaminants, requiring additional analytical methods if precise impurity identification is necessary.
Conclusion
DNA quantification using the NanoDrop spectrophotometer remains a cornerstone technique in molecular biology laboratories due to its speed, minimal sample requirement, and integrated purity assessment. García-Alegría et al. (2020) validated their methodological reliability using standard reference materials and biological DNA samples, demonstrating consistent performance under controlled conditions. Comparative research by Versmessen et al. (2024) underscores that spectrophotometric quantification may overestimate DNA concentration in are presence of contaminants, emphasizing the importance of interpreting purity ratios.
Practical guidance from Bitesize Bio (2025a, 2025b) highlights that reproducibility relies heavily on good laboratory technique, including proper blanking, pedestal cleaning, and careful pipetting. When used with awareness of its strengths and limitations, NanoDrop provides an efficient and informative method for DNA quantification at the undergraduate and research levels.
References
- García-Alegría, J., Anduro-Corona, I., Pérez-Martínez, C. J., Guadalupe Corella-Madueño, M. A., Rascón-Durán, M. L., & Astiazarán-García, H. (2020). Quantification of DNA through the NanoDrop spectrophotometer: Methodological validation using standard reference material and Sprague Dawley rat and human DNA. Heliyon, 6(8), e04563. https://pmc.ncbi.nlm.nih.gov/articles/PMC7719535/
- Versmessen, E., Van den Bossche, T., Van Coillie, E., & De Keersmaecker, S. C. J. (2024). Comparison of DeNovix, NanoDrop and Qubit for DNA quantification and impurity detection of bacterial DNA extracts. PLOS ONE, 19(6), e0305650. https://doi.org/10.1371/journal.pone.0305650
- Bitesize Bio. (2025). Why aren’t my NanoDrop results reproducible? Bitesize Bio. https://bitesizebio.com/26691/arent-nanodrop-results-reproducible/
- Bitesize Bio. (2025). The NanoDrop spectrophotometer: Quantification made easy. Bitesize Bio. https://bitesizebio.com/25329/nanodrop-spectrophotometer-pros-and-cons-2/
- Thermo Fisher Scientific. (n.d.). NanoDrop spectrophotometers applications. Thermo Fisher Scientific. https://www.thermofisher.com/np/en/home/industrial/spectroscopy-elemental-isotope-analysis/molecular-spectroscopy/uv-vis-spectrophotometry/instruments/nanodrop/applications.html
