
Accurate quantification of DNA is a fundamental requirement in molecular biology, biotechnology, and biomedical research. Many downstream applications, such as polymerase chain reaction (PCR), restriction digestion, cloning, sequencing, and next-generation sequencing library preparation, rely on precise DNA concentration and purity. Among the various techniques available, spectrophotometric DNA quantification remains one of the most widely used methods due to its simplicity, speed, and non-destructive nature.
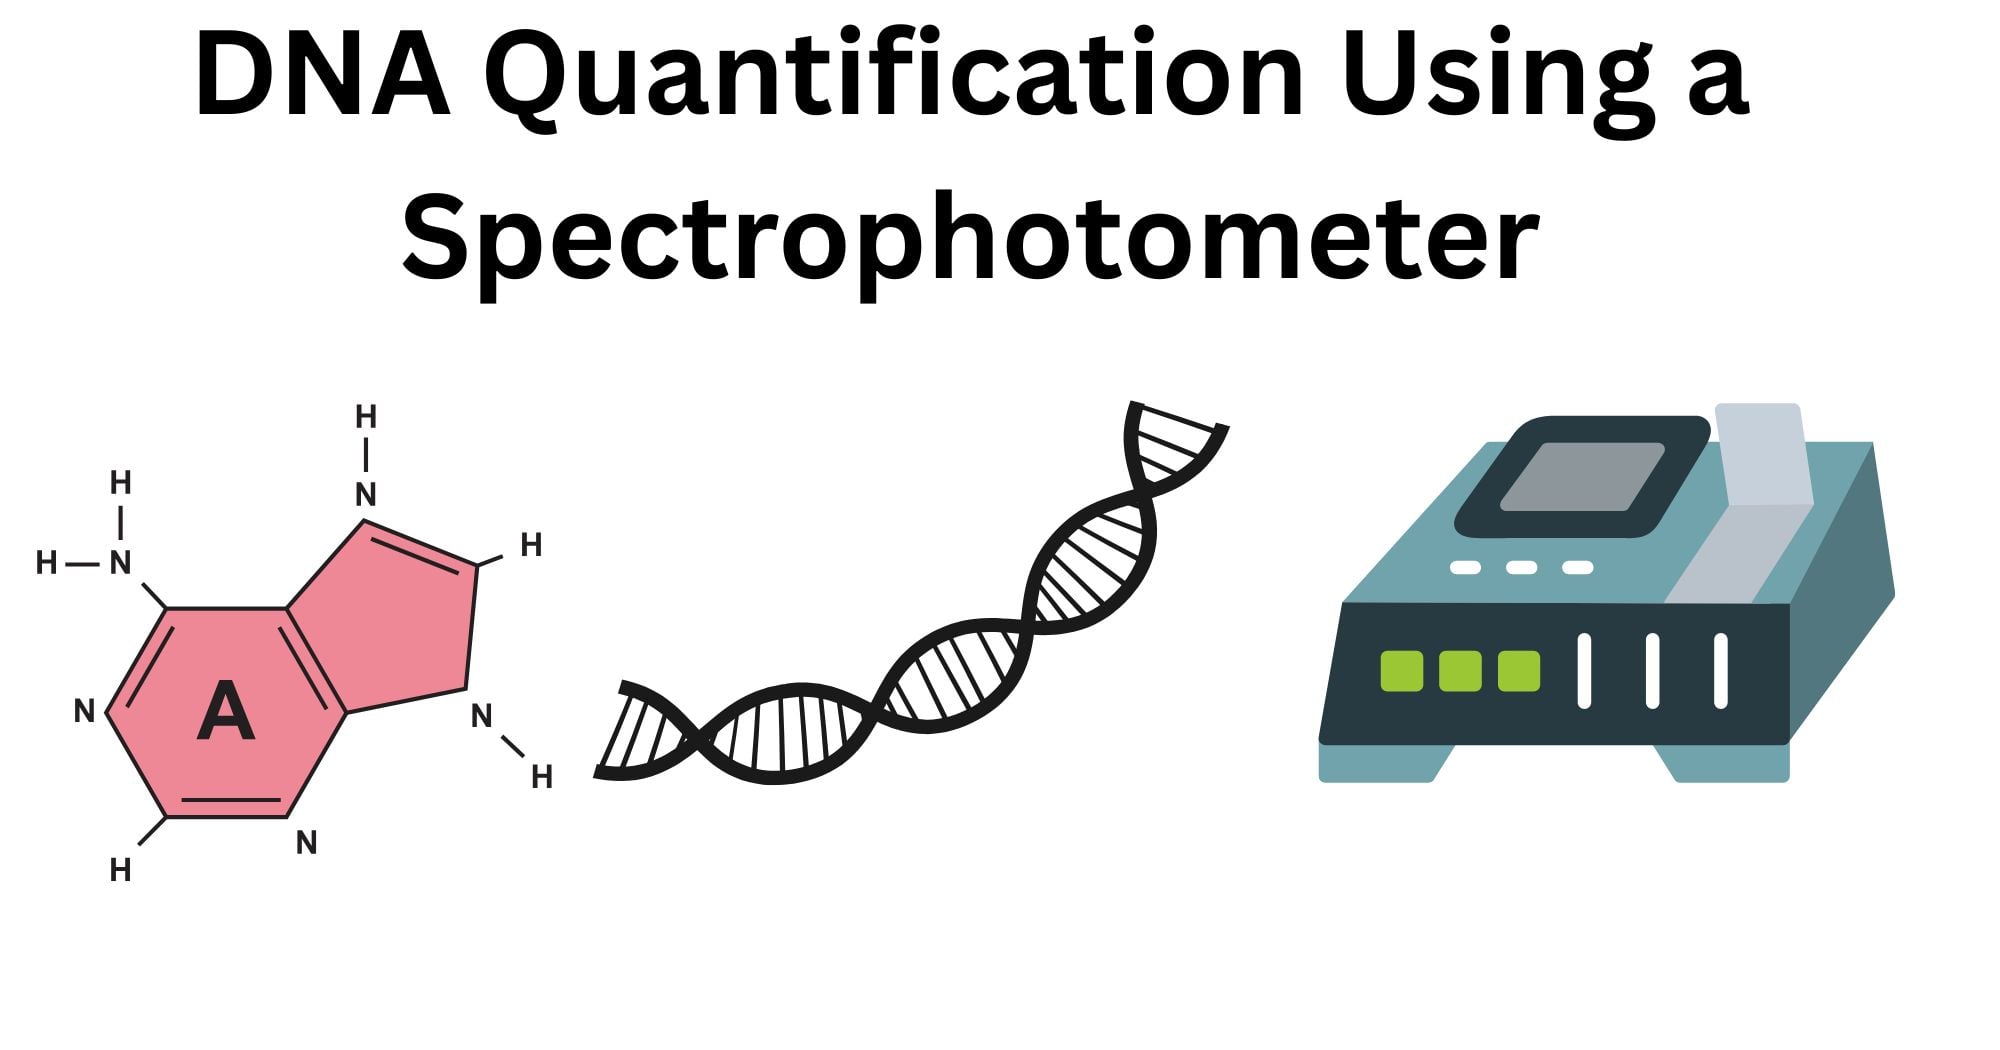
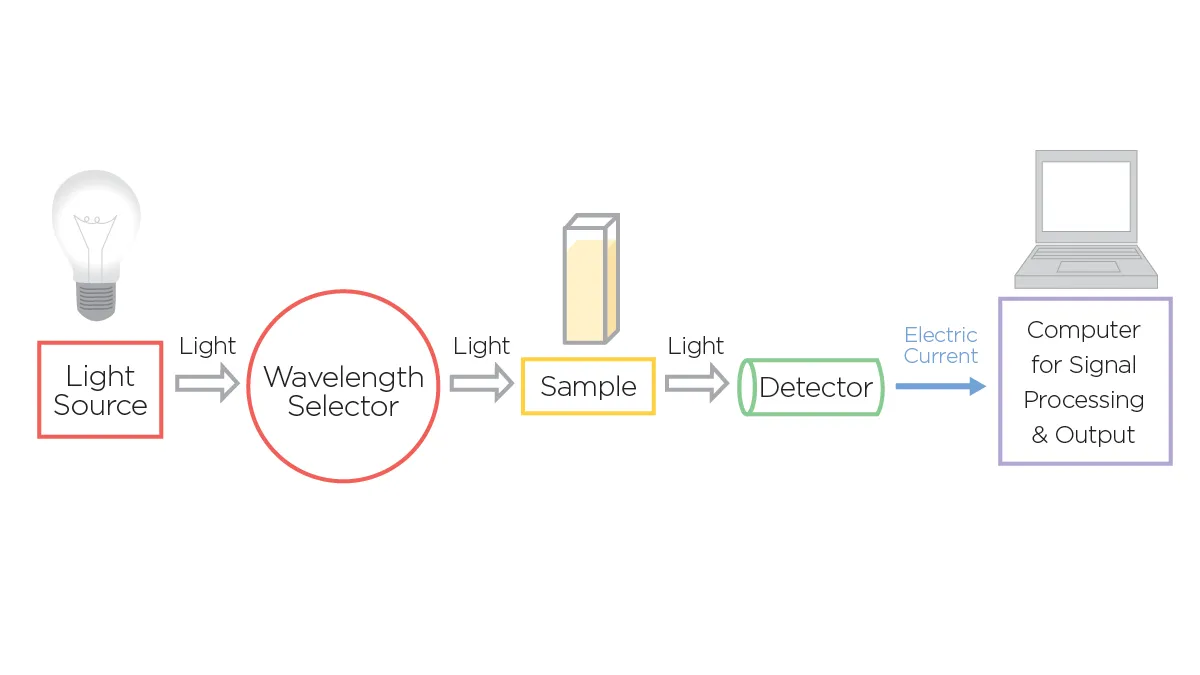
DNA quantification using a spectrophotometer is based on the ability of nucleic acids to absorb ultraviolet (UV) light, particularly at a wavelength of 260 nm. By measuring absorbance at this wavelength, the concentration of DNA in a sample can be estimated using established conversion factors.
Additionally, absorbance ratios such as A260/A280 and A260/A230 provide valuable information regarding DNA purity and the presence of contaminants like proteins, phenol, or salts (QIAGEN, n.d.).
Despite the emergence of fluorescence-based assays, spectrophotometric methods continue to be routinely used in teaching laboratories and research settings because they do not require specialized dyes or reagents. However, understanding the principles, limitations, and quality control measures associated with this method is essential to ensure reliable results (Desjardins & Conklin, 2010; Manchester, 1996).
Key Reagents of DNA Quantification Using a Spectrophotometer
Although spectrophotometric DNA quantification does not require complex reagents, certain materials are essential for accurate measurement.
| Reagent | Typical Concentration / Amount | Purpose |
| DNA sample | Variable (ng/µL to µg/µL) | Sample containing DNA to be quantified |
| DNase/RNase-free water | Used as a blank and diluent | Prevents nucleic acid degradation and background absorbance |
| DNA standard (optional) | Known concentrations | Calibration and validation of measurements |
| Quartz or plastic cuvettes | 1 cm path length | Holds a sample for absorbance reading |
| Cleaning tissue / lint-free wipes | As required | Prevents optical interference from smudges |
Principle of DNA Quantification Using a Spectrophotometer
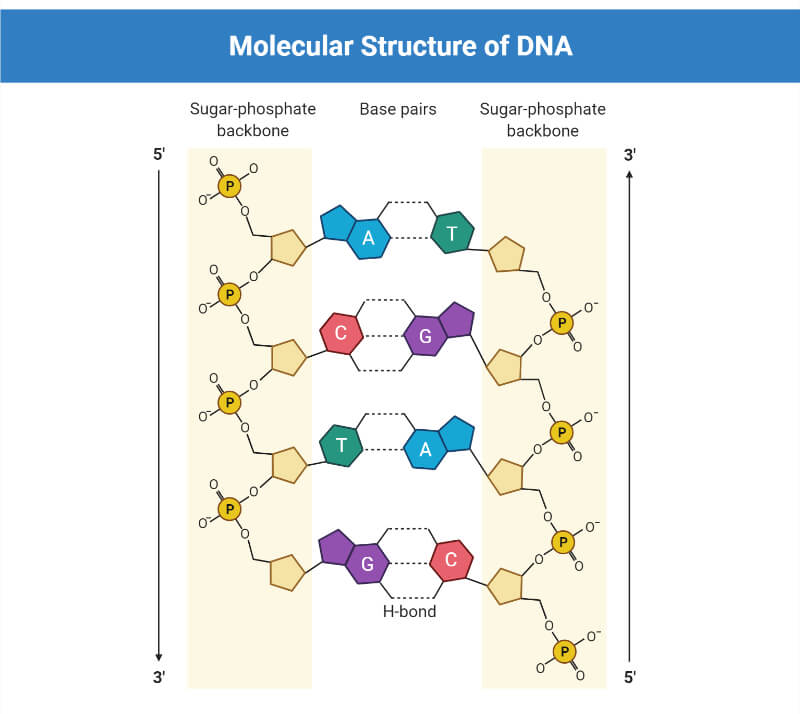
The principle of spectrophotometric DNA quantification is based on the Beer–Lambert law, which states that absorbance is directly proportional to the concentration of an absorbing substance and the path length of light through the sample. DNA and RNA absorb UV light maximally at 260 nm due to the presence of aromatic nitrogenous bases (QIAGEN, n.d.).
For double-stranded DNA (dsDNA), an absorbance (A260) of 1.0 corresponds to a concentration of approximately 50 µg/mL. This conversion factor allows direct calculation of DNA concentration from absorbance readings. In addition to A260, absorbance at 280 nm is measured to assess protein contamination, as aromatic amino acids absorb strongly at this wavelength. The ratio of A260/A280 is commonly used as an indicator of DNA purity, with values around 1.8 considered indicative of relatively pure DNA (Manchester, 1996).
Absorbance at 230 nm is also important, as contaminants such as phenol, guanidinium salts, and carbohydrates absorb at this wavelength. Therefore, spectrophotometric analysis provides both quantitative and qualitative information about nucleic acid samples (Desjardins & Conklin, 2010).
Protocol of DNA Quantification Using a Spectrophotometer
- Turn on the spectrophotometer and allow the UV lamp to warm up for at least 10–15 minutes to ensure stable readings.
- Thaw DNA samples on ice and mix gently by tapping or brief centrifugation. Avoid vortexing to prevent DNA shearing.
- Blank the DNA spectrophotometer with the diluent the sample is in.
- Tip: For accurate A260/A280 values, measure the absorbance in a slightly alkaline buffer (e.g., 10 mM Tris·Cl, pH 7.5).
- Measure the absorbance of your sample at 260 nm and 280 nm.
- Tip: To ensure reliability, readings should be between 0.1 and 1.0.
- Take a background reading at 320 nm (A320) to correct for turbidity or cloudiness in the sample.
- Calculate the DNA purity using the A260/A280 ratio. A ratio of ~1.8 is generally considered pure for DNA.
- Calculate the DNA concentration using the formula:
- Concentration (µg/mL) = (A260 reading – A320 reading) × dilution factor × 50 µg/mL.
Inference:
- Strong absorbance at A280, resulting in a low A260/A280 ratio, indicates the presence of contaminants, such as proteins.
- Strong absorbance at 270 nm and 275 nm may indicate the presence of contaminating phenol.
- Absorbance at 325 nm suggests contamination by particulates in the solution or dirty cuvettes.
Observations and Results
The primary observation obtained during spectrophotometric DNA quantification is the absorbance value at 260 nm. Higher absorbance corresponds to higher DNA concentration. Additional observations include A260/A280 and A260/A230 ratios, which provide insights into DNA purity.
Pure DNA typically shows an A260/A280 ratio close to 1.8. Ratios significantly lower than this may indicate protein contamination, while unusually high values may suggest RNA contamination. A260/A230 ratios between 2.0 and 2.2 are generally considered acceptable, whereas lower ratios indicate the presence of organic compounds or salts (QIAGEN, n.d.; Desjardins & Conklin, 2010).
Modifications of DNA Quantification Using a Spectrophotometer
- Microvolume spectrophotometry: Allows measurement using very small sample volumes, reducing DNA consumption while maintaining accuracy. This approach is especially useful for precious or low-yield samples and minimizes dilution errors during quantification (Desjardins & Conklin, 2010).
- Baseline correction across multiple wavelengths: Improves accuracy by compensating for background absorbance caused by contaminants. Measuring absorbance across a broader UV range helps identify abnormal spectral patterns and corrects systematic errors arising from buffers, salts, or organic impurities (QIAGEN, n.d.).
- Use of quartz cuvettes for low concentrations: Enhances sensitivity when working with dilute DNA samples due to better UV transparency. Quartz cuvettes reduce light scattering and absorbance interference, leading to more reliable measurements at low DNA concentrations (Manchester, 1996).
Troubleshooting of DNA Quantification Using a Spectrophotometer
| Problem | Likely Cause | Solution |
| Low A260/A280 ratio | Protein contamination | Re-purify DNA using cleanup methods |
| High absorbance variability | Dirty cuvettes or bubbles | Clean cuvettes and remove bubbles |
| Unexpectedly high concentration | RNA contamination | Treat the sample with RNase |
| Low A260/A230 ratio | Salt or phenol contamination | Additional washing or purification |
Quality Assessment of the Isolated cDNA
- A260/A280 ratio: Indicates protein contamination by comparing nucleic acid absorbance to that of aromatic amino acids. Pure double-stranded DNA typically shows a ratio around 1.8. Lower values suggest protein or phenol contamination, while higher ratios may indicate RNA presence or improper baseline correction during measurement.
- A260/A230 ratio: Reflects contamination from organic compounds and salts such as phenol, ethanol, carbohydrates, or chaotropic agents. Ideal values range between 2.0 and 2.2. Reduced ratios indicate incomplete purification and may negatively affect enzymatic reactions in downstream molecular biology applications.
- Spectral scan (220–320 nm): Helps identify abnormal absorbance patterns caused by impurities by displaying the full UV absorbance profile. Pure DNA shows a distinct peak at 260 nm and minimal absorbance elsewhere, whereas shoulders or elevated baselines suggest contamination or degraded nucleic acids (Desjardins & Conklin, 2010).
Safety Tips and Precautions of DNA Quantification Using a Spectrophotometer
- Use gloves at all times: Prevents contamination and protects samples from nucleases present on skin. Gloves also reduce the risk of introducing oils or residues that could affect absorbance readings and ensure safe handling of biological materials and laboratory equipment during the quantification process.
- Avoid direct UV exposure: UV light can be harmful to skin and eyes if instruments are opened improperly. Operators should keep instrument lids closed during measurements and follow manufacturer guidelines, as prolonged UV exposure may cause tissue damage and increase occupational laboratory hazards.
- Handle cuvettes carefully: Scratches or fingerprints can interfere with absorbance readings by scattering light. Cuvettes should be held by the frosted sides, cleaned with lint-free tissue, and inspected before use to maintain optical clarity and ensure consistent, reliable spectrophotometric measurements (Sper Scientific, n.d.).
- Avoid cross-contamination of samples and solutions: Careful pipetting practices are essential to prevent sample carryover. Fresh pipette tips should be used for each sample and reagent to maintain accuracy in DNA concentration measurements and prevent misleading absorbance readings due to contamination.
- Maintain a clean working environment: All procedures should be carried out on fresh bench paper, inside a laminar flow hood, or on an ethanol-treated bench surface. A clean workspace reduces environmental contamination and improves the reliability and reproducibility of spectrophotometric DNA quantification results.
- Orient centrifuge tubes correctly during centrifugation: Tubes should always be placed with the hinge facing upward during centrifugation. This practice helps locate the pellet accurately, prevents accidental disturbance of the DNA, and ensures consistent recovery of the sample after centrifugation steps.
- Avoid vortexing unless explicitly specified: Vortexing can cause mechanical shearing of DNA, particularly high–molecular-weight genomic DNA. Gentle mixing by tapping or brief centrifugation is preferred to preserve DNA integrity and ensure accurate spectrophotometric measurements.
Applications of DNA Quantification Using a Spectrophotometer
- PCR and qPCR setup: Ensures accurate template input for amplification reactions, which is critical for reproducibility and quantitative accuracy. Incorrect DNA concentrations can lead to inefficient amplification, nonspecific products, or biased quantification results in real-time PCR experiments.
- Cloning and restriction digestion: Requires precise DNA amounts for optimal enzyme activity and reaction efficiency. Accurate quantification ensures correct insert-to-vector ratios, improves ligation success, and prevents enzyme inhibition caused by excessive DNA or contaminating substances.
- Sequencing workflows: Prevents over- or under-loading of sequencing reactions, which can affect read quality and coverage. Reliable DNA quantification supports consistent library preparation and enhances data accuracy in both Sanger and next-generation sequencing platforms (Desjardins & Conklin, 2010).
Advantages of DNA Quantification Using a Spectrophotometer
- Rapid and simple: Measurements are obtained within seconds without complex preparation steps. This allows high-throughput analysis of multiple samples and makes the method particularly suitable for routine laboratory work and teaching laboratories with limited resources.
- Non-destructive: DNA samples can be reused after measurement, as no dyes or chemicals are added. This preserves valuable samples for downstream applications and is especially beneficial when working with limited or difficult-to-obtain biological material.
- No additional reagents required: Reduces cost and preparation time by relying solely on intrinsic nucleic acid absorbance. This simplicity minimizes experimental variability and makes spectrophotometric quantification accessible in laboratories without specialized consumables (QIAGEN, n.d.).
Limitations of DNA Quantification Using a Spectrophotometer
- Low specificity: Cannot distinguish DNA from RNA or free nucleotides because all nucleic acids absorb at 260 nm. As a result, total nucleic acid content may be overestimated in samples containing significant RNA contamination.
- Sensitivity to contaminants: Proteins, salts, and organic compounds significantly affect absorbance readings and purity ratios. Even small amounts of contaminants can lead to inaccurate concentration estimates, particularly when DNA purity is suboptimal after extraction.
- Less accurate at low concentrations: Background absorbance limits detection of dilute samples, reducing reliability below certain thresholds. In such cases, fluorescence-based assays offer greater sensitivity and specificity compared to spectrophotometric methods (Desjardins & Conklin, 2010).
Conclusion
DNA quantification using a spectrophotometer remains a fundamental technique in molecular biology laboratories due to its speed, simplicity, and dual ability to assess both concentration and purity. By exploiting the intrinsic UV absorbance properties of nucleic acids, this method provides reliable estimates of DNA concentration when samples are relatively pure. However, careful attention to sample preparation, instrument calibration, and absorbance ratios is essential for accurate interpretation. Although fluorescence-based methods offer greater sensitivity, spectrophotometric quantification continues to be a valuable and widely adopted approach, particularly in routine and educational laboratory settings.
References
- Haque, K. A., Pfeiffer, R. M., Beerman, M. B., Struewing, J. P., Chanock, S. J., & Bergen, A. W. (2003). Performance of high-throughput DNA quantification methods. BMC Biotechnology, 3, Article 20. https://doi.org/10.1186/1472-6750-3-20
- QIAGEN. (n.d.). Spectrophotometric measurement of DNA concentration. QIAGEN Knowledge Hub.https://www.qiagen.com/us/knowledge-and-support/knowledge-hub/bench-guide/dna/analysing-dna/spectrophotometric-measurement-of-dna-concentration
- Sper Scientific. (n.d.). Spectrophotometer selection and troubleshooting: A practical guide. Sper Scientific Direct.https://sperdirect.com/blogs/news/spectrophotometer-selection-and-troubleshooting-a-practical-guide
- Desjardins, P., & Conklin, D. (2010). NanoDrop microvolume quantitation of nucleic acids. Journal of Visualized Experiments, (45), e2565. https://doi.org/10.3791/2565 https://pmc.ncbi.nlm.nih.gov/articles/PMC3346308/
- University of Toledo. (n.d.). DNA quantification [PDF]. EESC Science Faculty Protocols. http://www.eeescience.utoledo.edu/faculty/sigler/Von_Sigler/LEPR_Protocols_files/DNA%20quantification.pdf
- Foster, B. (2024, November 5). A guide to DNA and RNA quantification and quality. Technology Networks. https://www.technologynetworks.com/genomics/articles/a-guide-to-dna-and-rna-quantification-and-quality-392900
