Interesting Science Videos
Z-test Definition
z-test is a statistical tool used for the comparison or determination of the significance of several statistical measures, particularly the mean in a sample from a normally distributed population or between two independent samples.
- Like t-tests, z tests are also based on normal probability distribution.
- Z-test is the most commonly used statistical tool in research methodology, with it being used for studies where the sample size is large (n>30).
- In the case of the z-test, the variance is usually known.
- Z-test is more convenient than t-test as the critical value at each significance level in the confidence interval is the sample for all sample sizes.
- A z-score is a number indicating how many standard deviations above or below the mean of the population is.

Z-test formula
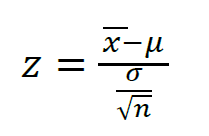
For the normal population with one sample:

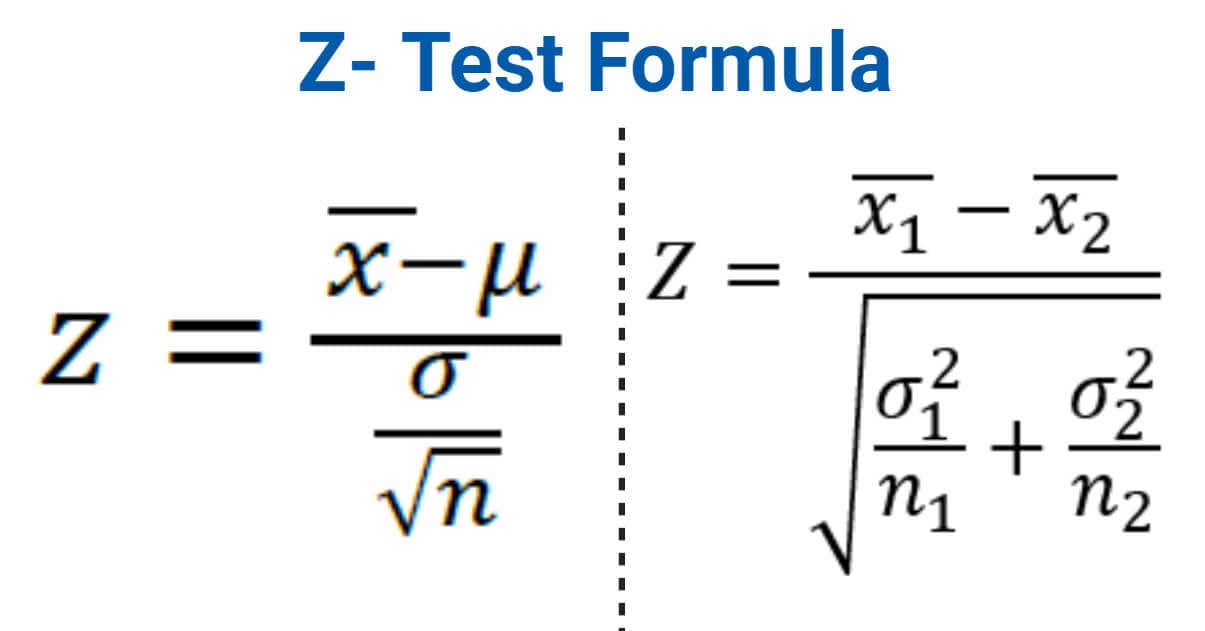
where x̄ is the mean of the sample, and µ is the assumed mean, σ is the standard deviation, and n is the number of observations.
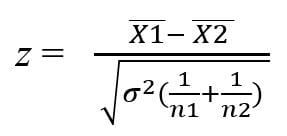
z-test for the difference in mean:

where x̄1 and x̄2 are the means of two samples, σ is the standard deviation of the samples, and n1 and n2 are the numbers of observations of two samples.
One sample z-test (one-tailed z-test)
- One sample z-test is used to determine whether a particular population parameter, which is mostly mean, significantly different from an assumed value.
- It helps to estimate the relationship between the mean of the sample and the assumed mean.
- In this case, the standard normal distribution is used to calculate the critical value of the test.
- If the z-value of the sample being tested falls into the criteria for the one-sided tets, the alternative hypothesis will be accepted instead of the null hypothesis.
- A one-tailed test would be used when the study has to test whether the population parameter being tested is either lower than or higher than some hypothesized value.
- A one-sample z-test assumes that data are a random sample collected from a normally distributed population that all have the same mean and same variance.
- This hypothesis implies that the data is continuous, and the distribution is symmetric.
- Based on the alternative hypothesis set for a study, a one-sided z-test can be either a left-sided z-test or a right-sided z-test.
- For instance, if our H0: µ0 = µ and Ha: µ < µ0, such a test would be a one-sided test or more precisely, a left-tailed test and there is one rejection area only on the left tail of the distribution.
- However, if H0: µ = µ0 and Ha: µ > µ0, this is also a one-tailed test (right tail), and the rejection region is present on the right tail of the curve.
Two sample z-test (two-tailed z-test)
- In the case of two sample z-test, two normally distributed independent samples are required.
- A two-tailed z-test is performed to determine the relationship between the population parameters of the two samples.
- In the case of the two-tailed z-test, the alternative hypothesis is accepted as long as the population parameter is not equal to the assumed value.
- The two-tailed test is appropriate when we have H0: µ = µ0 and Ha: µ ≠ µ0 which may mean µ > µ0 or µ < µ0
- Thus, in a two-tailed test, there are two rejection regions, one on each tail of the curve.
Z-test examples
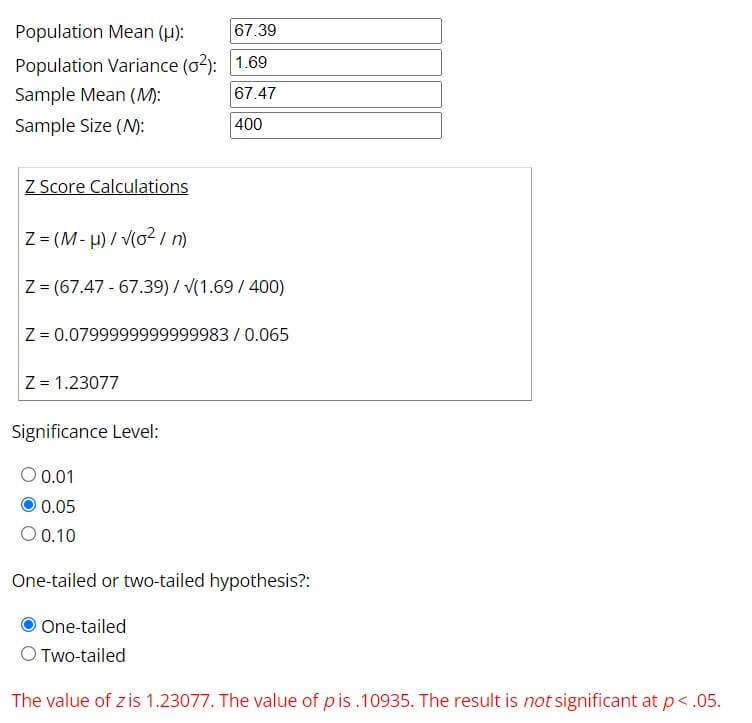
If a sample of 400 male workers has a mean height of 67.47 inches, is it reasonable to regard the sample as a sample from a large population with a mean height of 67.39 inches and a standard deviation of 1.30 inches at a 5% level of significance?
Taking the null hypothesis that the mean height of the population is equal to 67.39 inches, we can write:
H0 : µ = 67.39“
Ha: µ ≠ 67.39“
x̄ = 67.47“, σ = 1.30“, n = 400
Assuming the population to be normal, we can work out the test statistic z as under:

Z = 1.231

z-test applications
- Z-test is performed in studies where the sample size is larger, and the variance is known.
- It is also used to determine if there is a significant difference between the mean of two independent samples.
- The z-test can also be used to compare the population proportion to an assumed proportion or to determine the difference between the population proportion of two samples.
Z-test vs T-test (8 major differences)
| Basis for comparison | T-test | Z-test |
| Definition | The t-test is a test in statistics that is used for testing hypotheses regarding the mean of a small sample taken population when the standard deviation of the population is not known. | z-test is a statistical tool used for the comparison or determination of the significance of several statistical measures, particularly the mean in a sample from a normally distributed population or between two independent samples. |
| Sample size | The t-test is usually performed in samples of a smaller size (n≤30). | z-test is generally performed in samples of a larger size (n>30). |
| Type of distribution of population | t-test is performed on samples distributed on the basis of t-distribution. | z-tets is performed on samples that are normally distributed. |
| Assumptions | A t-test is not based on the assumption that all key points on the sample are independent. | z-test is based on the assumption that all key points on the sample are independent. |
| Variance or standard deviation | Variance or standard deviation is not known in the t-test. | Variance or standard deviation is known in z-test. |
| Distribution | The sample values are to be recorded or calculated by the researcher. | In a normal distribution, the average is considered 0 and the variance as 1. |
| Population parameters | In addition, to the mean, the t-test can also be used to compare partial or simple correlations among two samples. | In addition, to mean, z-test can also be used to compare the population proportion. |
| Convenience | t-tests are less convenient as they have separate critical values for different sample sizes. | z-test is more convenient as it has the same critical value for different sample sizes. |
References and Sources
- C.R. Kothari (1990) Research Methodology. Vishwa Prakasan. India.
- https://ncss-wpengine.netdna-ssl.com/wp-content/themes/ncss/pdf/Procedures/PASS/One-Sample_Z-Tests.pdf
- https://www.wallstreetmojo.com/z-test-vs-t-test/
- https://sites.google.com/site/fundamentalstatistics/chapter-13
- 3% – https://www.investopedia.com/terms/z/z-test.asp
- 2% – https://www.coursehero.com/file/61052903/Questions-statisticswpdf/
- 2% – https://towardsdatascience.com/everything-you-need-to-know-about-hypothesis-testing-part-i-4de9abebbc8a
- 2% – https://ncss-wpengine.netdna-ssl.com/wp-content/themes/ncss/pdf/Procedures/PASS/One-Sample_Z-Tests.pdf
- 1% – https://www.slideshare.net/MuhammadAnas96/ztest-with-examples
- 1% – https://www.mathandstatistics.com/learn-stats/hypothesis-testing/two-tailed-z-test-hypothesis-test-by-hand
- 1% – https://www.infrrr.com/proportions/difference-in-proportions-hypothesis-test-calculator
- 1% – https://keydifferences.com/difference-between-t-test-and-z-test.html
- 1% – https://en.wikipedia.org/wiki/Z-test
- 1% – http://www.sci.utah.edu/~arpaiva/classes/UT_ece3530/hypothesis_testing.pdf
- <1% – https://www.researchgate.net/post/Can-a-null-hypothesis-be-stated-as-a-difference
- <1% – https://www.isixsigma.com/tools-templates/hypothesis-testing/making-sense-two-sample-t-test/
- <1% – https://www.investopedia.com/terms/t/two-tailed-test.asp
- <1% – https://www.academia.edu/24313503/BIOSTATISTICS_AND_RESEARCH_METHODS_IN_PHARMACY_Pharmacy_C479_4_quarter_credits_A_Course_for_Distance_Learning_Prepared

The formula for Z test provided for testing the single mean is wrong. The correct formula is
wrong. Please check and correct it. It should be Z = (𝑥̅−𝜇)/𝜎/√n
Hi Ramnath, Sorry for the mistake. Thank you so much for the correction. We have updated the page with correct formula.