UV-Vis Spectroscopy or Ultraviolet-visible spectroscopy or Ultraviolet-visible spectrophotometer (UV-Vis) is also called absorption spectroscopy or reflectance spectroscopy in the ultraviolet-visible spectral region.
Electron transition takes place, so it is also called electron spectroscopy. It is a cost-effective, simple, versatile, and non-destructive technique that allows the sample to be used again for further analysis. It is a qualitative, quantitative, and analytical technique that compares a sample with a blank or reference sample to measure the amount of discrete ultraviolet and visible light absorbed or transmitted through a particular sample using Beer-Lambert law. It studies under vacuum conditions.
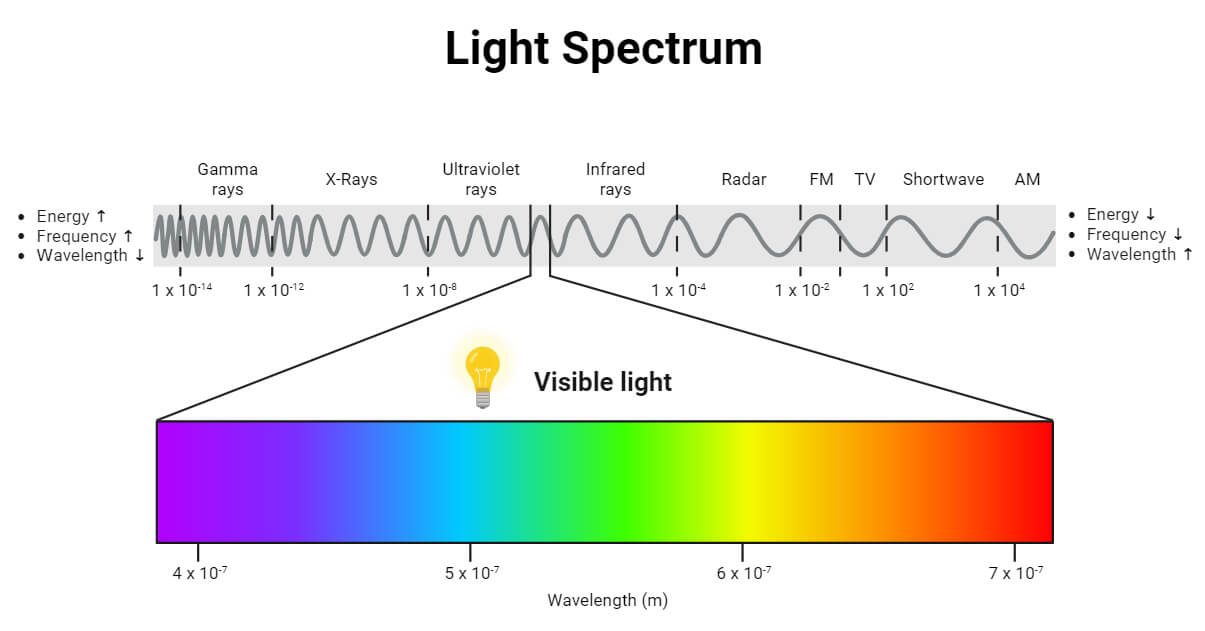
The wavelength of UV-vis spectroscopy ranges from 190 nm to 800 nm. The UV region ranges from 190 to 400 nm, and the visible region from 400 to 800 nm. Near UV region is 190 nm to 400 nm, and far UV region is below 200 nm. The shorter the wavelength, the higher will be the frequency and energy. It occurs in UV region. Similarly, the higher the wavelength, the lower the frequency and energy in the visible region.

Its properties depend on sample composition and concentration. It helps to identify, assess purity, and quantify the components of the sample by analyzing the pattern of absorption and transmission of light. It may apply in several sample types, such as monolithic solids, liquids, glass, powders, and thin films.
Absorbance (A): It, also known as optical density (OD), is the amount of light absorbed by the object and can be expressed as follows:
Absorbance (A)= -log(T)
Transmittance (T): It is measured by dividing the intensity spectrum of light transmitted through a sample (I) by the intensity spectrum of light transmitted through the blank (I0).
T= I/Io
Interesting Science Videos
UV-Vis Spectroscopy Principle
When a specific wavelength of light hits a molecule, that molecule gets excited. Once the electron excites, it excites from the ground (lower) energy state to the higher energy state. When an electron jumps off, it absorbs light energy because electrons in the orbital at a lower energy state utilize energy to move to a higher energy level.
Energy is neither created nor destroyed but can transform energy from one form to another. On passing EMR (UV- Vis range 200- 800 nm), only light possessing the precise amount of energy that can cause transitions from one level to another will absorb because matter’s energy levels are quantized.
If the energy is utilized, the intensity of light received is lost. At this time, the energy absorbed by the electrons will equal the energy difference between the two energy levels.
During this stage, electron transition occurs. So, after the interaction of electromagnet radiation, the spectra received are called absorption spectra. Hence, it is called electron spectroscopy. Similarly, when electrons in the orbital at a higher energy level move to the ground energy level, the spectra received are called emissions.
Beer-Lambert Law equation is the principle behind absorbance spectroscopy.
The concentration of the sample can be determined directly from the absorption of spectra produced by these samples at specific wavelengths using the Beer-Lambert law.
What is Beer-Lambert Law?
When a beam of light allows it to pass through a transparent medium, the rate at which an intensity decreases with medium thickness is directly proportional to the light beam’s intensity.
According to the Beer-Lambert Law, the absorbance is directly proportional to the concentration of the substance in the solution. Therefore, a sample’s concentration can also be determined using UV-visible spectroscopy.
The Beer-Lambert Law can be expressed in the form of the following equation:
A = –log T = –log (I ⁄ Io ) = log(Io ⁄ I)= ecl
A = ecl
Where A = absorbance
l = optical path length of the cell or cuvette or sample holder(cm)
c = concentration of the solution (mol dm-3)
e = molar absorptivity of the compound or molecule in solution, which is constant for a particular substance at a particular wavelength (dm3 mol-1 cm-1)
Following the Beer-Lambert Law, the plot of absorbance versus concentration should be linear if the absorbance of a series of sample solutions with known concentrations is measured and plotted against equivalent concentrations. This graph is known as a calibration graph.

Instrumentation of UV-Vis Spectroscopy
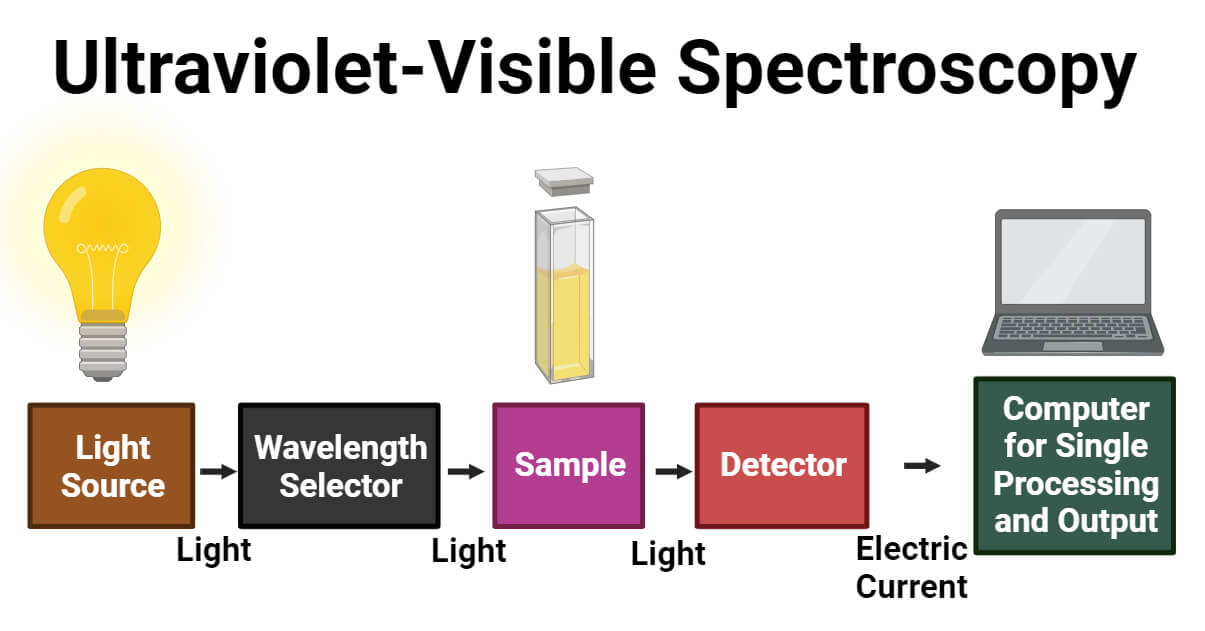
The main components of UV- Vis spectrophotometer are:
- Light Source
- Wavelength selector
- Sample container
- Detectors
1. Light Source
It is essential for emitting light in a wide range of wavelengths to work in a UV-Vis spectrometer. Commonly, a high-intensity light source used for both UV and Visible ranges is a xenon lamp. In contrast to tungsten and halogen lamps, it is less stable and more costly. So, the two lamps for this instrument are a deuterium lamp for UV light and a halogen or tungsten lamp for visible light as a source of light. The two lamps provide good intensity. While measuring the intensity of the light, the spectrometer ought to switch. A smoother transition is possible when the switchover occurs between 300 and 350 nm because the light emission for both visible and UV light sources is the same amount of light at that wavelength.
2. Wavelength selector
In order to allow sample examination using the wavelengths that the light source emits, wavelength selection helps to ascertain which wavelength is appropriate for the type of analyte and sample. The commonly used wavelength selector in the UV-Vis spectrometer is the monochromator. It separates light into a narrow band of wavelength.
From the entrance slit, radiation of different wavelengths will enter the monochromator. At a particular angle, the beam will collide and strike the dispersing element. A monochromator contains a prism that separates all different wavelengths of light in a single beam. It bends the monochromatic light and produces non-linear dispersion. Only single radiation or color of a specific wavelength will allow it to leave the monochromator and pass through its ultimate chain or exit slit.
3. Sample Container
In a single-beam spectrophotometer, all the radiation coming from the light source passes through the sample as one beam. Single-beam spectrophotometers can determine color by comparing the light sources’ intensities before and after a sample is inserted. The wavelength range measure is 190–750 nm; however, it may go up to 1100 nm.
In a double-beam spectrophotometer, all the radiation coming from the light source splits into two beams: one passes through the sample, and the other only passes through the reference. Similarly, Double-beam spectrophotometers offer a wavelength range of 190 to 1100 nm. Moreover, the double-beam spectrophotometer measures absorbance versus wavelength or sample and reference beam ratio.
The reference detector is used to adjust lamp brightness fluctuations for each measurement. After collecting the sample, the sample detector is measured in the sample position and deducted from the sample spectrum. It contains both a reference chamber and a sample chamber. The sample is kept in a flat, transparent container called a cuvette or sample chamber. The solvent in which the sample dissolves is kept in the reference chamber, also known as the blank. The sample cell’s choice depends on the path length, shape, size, and transmission characteristics at the desired wavelength and the relative expense.
For each wavelength, the light intensity passes through the beam separator to the reference chamber (Io) and sample chamber (I). The intensity of light symbolizes as Io measures the number of photons per second. When the light passes through the blank solution, it does not absorb light, referred to as (l). If sample I is less than Io, the sample has absorbed some light.
The absorbance (A) of the sample is related to I and Io according to the following equation:
Absorbance (A)= -log(T)= -log (I/Io)
This equation shows the relationships between absorbance and transmittance.
Also, the fraction I divided by Io is called transmittance (T), which expresses how much light has passed through a sample.
T= I/Io
T= I/Io = e–kbc
Where: – I o is the incident intensity
– I is the transmitted intensity
– e is the base of natural logarithms
– k is a constant
– b is the path length (usually in cms).
The lighter the refracted, the more transmittance occurs. The lower the absorbance, the higher the transmittance.
In UV and visible regions, fused silica or quartz cuvettes are commonly used.
4. Detector
Detectors rely on photoelectric coatings or semiconductors. It converts the incoming light from the sample into an electric signal or current. The higher the current, the greater the intensity. It has the properties of low noise and high sensitivity, so it gives a linear response. Each detector has a variety of wavelength ranges and different sensitivity. Finally, The data recorder usually plots the absorbance against wavelength (nm) in the UV and visible section of the electromagnetic spectrum.
Applications of UV-Vis Spectroscopy
DNA and RNA analysis
It focuses on verifying the concentration and purity of DNA and RNA, which plays a crucial role in downstream applications like sequencing. It ensures whether the DNA or RNA samples prepared for sequencing are contaminant or pure.
Since pure DNA has an absorbance ratio of 1.8 and pure RNA has a ratio of 2, the 260 nm/280 nm absorbance ratio is crucial for displaying protein contamination in nucleic acids. 260nm/230nm absorbance ratio varies for RNA and DNA (2.15 to 2.50).
Pharmaceutical analysis
It is essential in drug discovery and development, quantifying impurities in drug ingredients, dissolution testing of solid oral dosage forms like tablets, and chemical identification and quantification. It allows overlapping absorbance peaks in the original spectra using mathematical derivatives to identify pharmaceutical compounds.
Likewise, the Identification of pharmaceutical compounds, Chlortetracycline (antibiotic) and benzocaine (anesthetic) in veterinary powder formulation, by overlapping the absorbance peaks in UV spectra using mathematical derivatives.
Food and Beverage Applications
It applies to assessing the sensory attributes, nutritional components of food and its products such as beer, wine, juices, energy and soft drinks, waters, other thin liquids and thick liquids (honey, oils), fruits, vegetables, caffeine content, etc., and the chemical composition of ingredients and detect contaminants or adulterant to ensure the product is safe and healthier.
It can be used in quality control in wine by identifying anthocyanin in blueberries, raspberries, and cherries. It can evaluate food and food product color, flavor, and aroma.
Bacterial culture
It is essential in the biomass growth curve. It is used in culturing bacteria by estimating cell concentrations and growth tracking in measuring optical density at 600 nm. 600 nm is best to preserve the optical properties of culture media where bacteria grow and to avoid cell damage when there is a need for continuous experimentation.
Other Applications
- In the cosmetic industry, it is used to evaluate photostability agents and color index, quantify dyes and antioxidants, and detect adulteration.
- It is used in material science, like the characterization of small nanoparticles and to determine battery composition.
- It is used to examine structural protein changes by tracking changes in peak wavelength absorbance.
- In wastewater treatment, it is employed in kinetics and monitoring studies of dyes and dye byproducts to ensure adequate dye removal by comparing their spectra over time.
- It is used in cancer research to estimate hemoglobin concentration.
- It is used to measure color index to monitor transformer oil as a preventive measure to ensure electric power is delivered safely.
- It is used in petrochemistry for characterizing crude oil, quality of crude oil gravity, formulation of indices for aromatic content, and sulfur content.
- In the biochemistry and genetic fields, it is used to quantify DNA, protein/enzyme, and thermal denaturation of protein.
Advantages of UV-Vis Spectroscopy
- It is non-destructive and reusable.
- It is easy to operate and the fastest method to interpret data because it gives accurate readings.
- It is an inexpensive technique.
- It is more convenient.
Disadvantages of UV-Vis Spectroscopy
- It may take time to prepare using the machine.
- Spectrometer reading might be affected if it keeps with any electronic noise, outside light, and other contaminants.
- The accuracy of the machine’s measurement could be impacted by stray light from defective equipment design because the linearity range and substance absorbency measuring are likely to be reduced by stray light.
References
- https://byjus.com/chemistry/uv-vis-spectroscopy/
- https://www.smacgigworld.com/blog/applications-uv-vis-spectroscopy.php
- https://suntrics.com/tech-blogs/uv-vis-spectroscopy/
- https://www.mt.com/in/en/home/applications/Application_Browse_Laboratory_Analytics/uv-vis-spectroscopy/uvvis-spectroscopy-explained.html
- https://edu.rsc.org/download?ac=12904
- https://www.technologynetworks.com/analysis/articles/uv-vis-spectroscopy-principle-strengths-and-limitations-and-applications-349865
- https://www.agilent.com/cs/library/primers/public/primer-uv-vis-basics-5980-1397en-agilent.pdf
- https://byjus.com/chemistry/spectrophotometer-principle/
- https://www.slideshare.net/mariomS7/uvvis-spectroscopy
- https://www.labcompare.com/10-Featured-Articles/592706-Tech-Compare-Single-vs-Double-Beam-Spectrophotometers/
- https://www.hunterlab.com/blog/single-beam-vs-double-beam-spectrophotometer/
- https://www.slideshare.net/msakhan61/uv-visible-spectroscopy-principles-and-instrumentation

Simple and very easy to understand.