- There are arguably two kinds of tests used for assessing people’s health: diagnostic tests and screening tests.
- screening tests typically have advantages over diagnostic tests such as placing fewer demands on the healthcare system and being more accessible as well as less invasive, less dangerous, less expensive, less time-consuming, and less physically and psychologically discomforting for clients.
- Screening tests are also, however, well-known for being imperfect and they are sometimes ambiguous.
- It is, therefore, important to determine the extent to which these tests are able to identify the likely presence or absence of a condition.
- In addition to sensitivity and specificity, the performance of a screening test is measured by its “predictive value” which reflects the diagnostic power of the test.
- Sensitivity and specificity measure the accuracy of the test (not any relation to the disease or population), whereas Positive Predictive Value and Negative Predictive Value measure the proportion of people whose test results reflect their health status and therefore are affected by the disease prevalence.
- Positive predictive value refers to the probability of the person having the disease when the test is positive.
- Negative predictive value refers to the probability of the person not having the disease when the test is negative.
- The positive and negative predictive values (PPV and NPV respectively) are the proportions of positive and negative results in statistics and diagnostic tests that are true positive and true negative results, respectively.
- The PPV and NPV describe the performance of a diagnostic test or other statistical measures.
- A high result can be interpreted as indicating the accuracy of such a statistic.

Interesting Science Videos
Positive Predictive Value
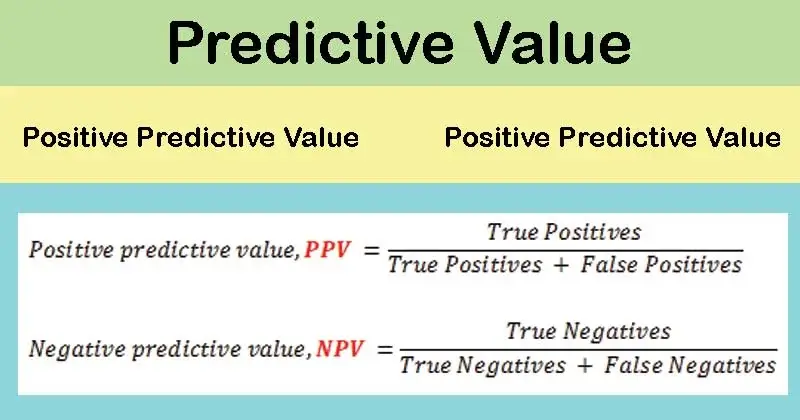
The positive predictive value (PPV) is defined as
PPV = (number of true positives) / {(number of true positives) + (number of false positives)}
= number of true positives/ number of positive calls
where a “true positive” is the event that the test makes a positive prediction, and the subject has a positive result under the gold standard, and
a “false positive” is the event that the test makes a positive prediction, and the subject has a negative result under the gold standard.
- The ideal value of the PPV, with a perfect test, is 1 (100%), and the worst possible value would be zero.
Negative Predictive Value
The negative predictive value is defined as:
NPV = (number of true negatives) / {(number of true negatives) + (number of false negatives)}
= number of true negatives/number of negative calls
where a “true negative” is the event that the test makes a negative prediction, and the subject has a negative result under the gold standard, and
a “false negative” is the event that the test makes a negative prediction, and the subject has a positive result under the gold standard.
- The ideal value of the NPV, with a perfect test, is 1 (100%), and the worst possible value would be zero.
Predictive Values and Prevalence
- Positive and negative predictive values are directly related to the prevalence of the disease in the population.
- Assuming all other factors remain constant, the PPV will increase with increasing prevalence; and NPV decreases with an increase in prevalence.
Significance of Predictive Value
Predictive values are important to determine the extent to which screening tests are able to identify the likely presence or absence of a condition of interest so that their findings encourage appropriate decision-making.
References
- Park, K. (n.d.). Park’s textbook of preventive and social medicine.
- Beaglehole, Robert, Bonita, Ruth, Kjellström, Tord & World Health Organization. (1993). Basic epidemiology, Updated reprint. World Health Organization.
- Hennekens CH, Buring JE. Epidemiology in Medicine, Lippincott Williams & Wilkins, 1987.
- White, F., Stallones, L., & Last, J. M. (2013). Global public health: Ecological foundations. New York, NY: Oxford University Press.
- http://sphweb.bumc.bu.edu/otlt/MPH-Modules/EP/EP713_Screening/EP713_Screening5.html
- https://newonlinecourses.science.psu.edu/stat507/node/71/
- Parikh, R., Mathai, A., Parikh, S., Chandra Sekhar, G., & Thomas, R. (2008). Understanding and using sensitivity, specificity and predictive values. Indian journal of ophthalmology, 56(1), 45–50. doi:10.4103/0301-4738.37595
- https://www.bmj.com/about-bmj/resources-readers/publications/epidemiology-uninitiated/10-screening
- https://www.frontiersin.org/articles/10.3389/fpubh.2017.00307/full
