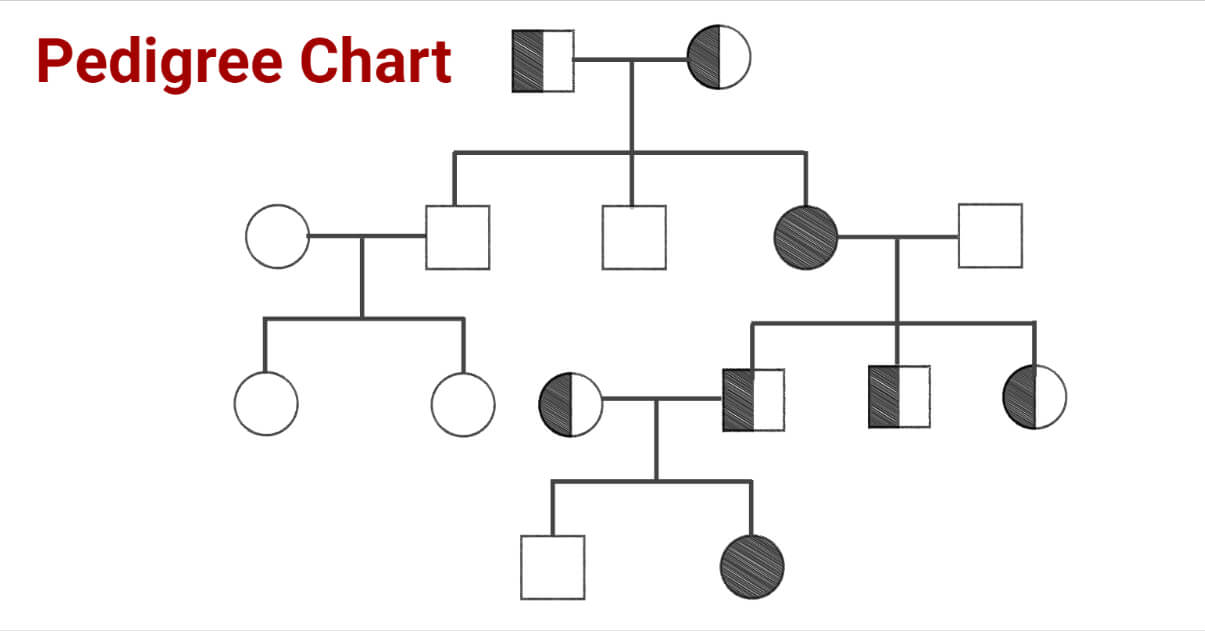
A pedigree chart is an illustration that represents the presence and emergence of different phenotypes of a significant gene of an organism and the way it passes from its ancestors or predecessors.

It is basically a chart that is formed and analyzed to observe the particular traits that are being passed from one generation to the other in human beings to study the genetic variations in different generations.
It is also known as the “Family Tree”.
Interesting Science Videos
Interpretation of the Pedigree Chart
A family member noticed initially by the geneticist is called a propositus.
Usually, the propositus phenotype is distinctive in some way. E.g., a dwarf. The investigator then traces the history of the person supposed to be of interest through the family history, and the genealogy or family tree is plotted with some particular symbols.
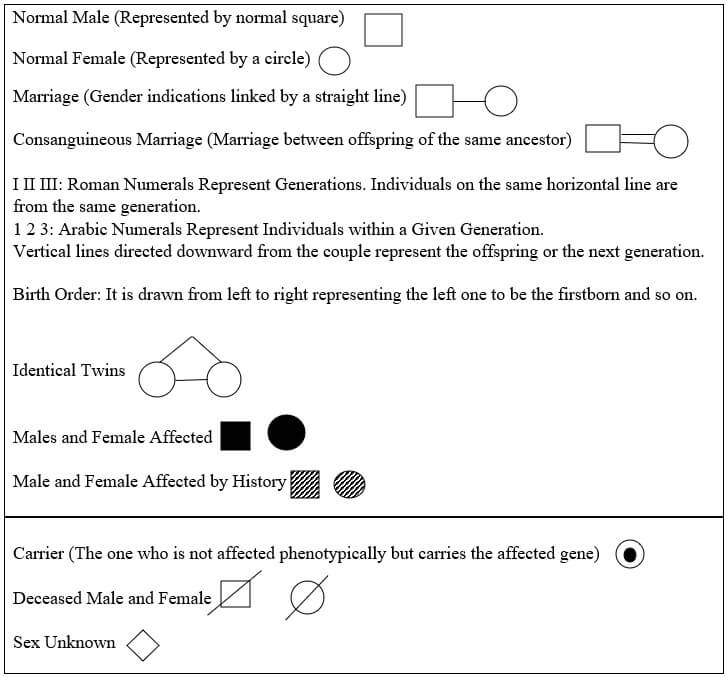
Some of the symbols used in the Pedigree Chart are as follows:

- Each individual included in the pedigree carries two instructions that are inherited from male and female parents. Those instructions are named alleles. They can be homozygous (carrying the same character) or heterozygous (carrying a different character).
- At first phenotypic data is taken from the various generations and the pedigree chart is prepared using the respective symbols. To identify whether the traits are recessive or dominant, the collected data is carefully analyzed.
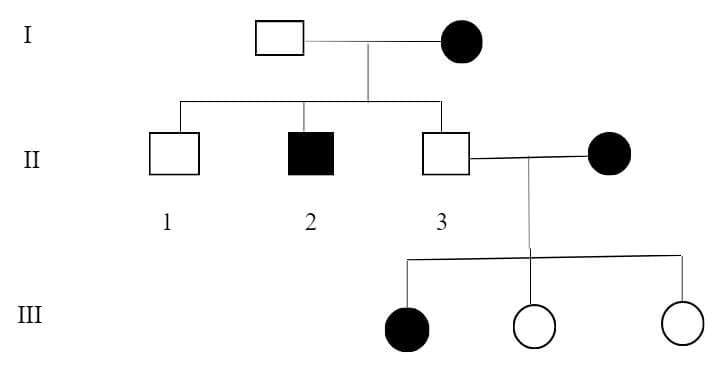
- The analysis is mentioned as per the given example. In the case of the traits that carry the dominant gene, the following things come into consideration:
- If the offspring are affected, then there must be at least one parent already affected.
- The specific dominant phenotype can be observed in all generations of that family tree.
- For the offspring to be perfectly normal, i.e. unaffected, both parents should be free from affected genes.

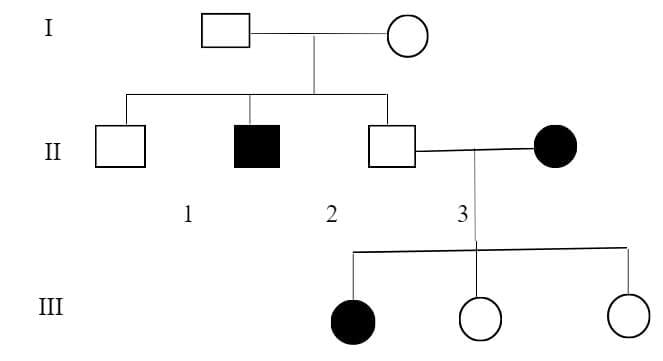
In the case of those traits that possess recessive genes, the following things are considered:
- The parents who are not affected can also have abnormal offspring.
- Both male and female offspring can be affected equally.

The mode of inheritance should be understood initially and analyzed to construct a pedigree and predict the chance of the future offspring being abnormal.
The inheritance pattern or pedigree charts can be of the following types:
- Autosomal: This includes the affected genes present on the autosomes or vegetative chromosomes. Such as, in humans, among 23 pairs of total chromosomes, 22 pairs are autosomes.
- Dominant: It can be seen in every generation i.e., continuous without skipping any generation. Children of abnormal parents can also be unaffected. Examples of autosomal dominant diseases are Marfan Syndrome, Retinoblastoma, Huntington’s disease, etc.
- Recessive: It might not be seen in some generations. In this type, even if both parents are normal, the offspring may be abnormal. Examples of these diseases are cystic fibrosis, tay-sachs disease, etc.
- Sex-linked: This includes the affected genes present on the sex chromosomes, which comprise only one pair among 23 pairs in humans. They are called the X and Y chromosomes. X-linked infections are mostly studied as there is the potential of its transfer to both genders, while the Y-linked can only be transferred between males as only males possess Y chromosomes. Examples of sex-linked diseases include color blindness, Hemophilia, etc.
- Dominant: In this type, all daughters of the father containing abnormal dominant X-linked genes will be affected, while the sons cannot be affected if the mother carries normal genes. Examples of X-linked dominant diseases are orofaciodigital syndrome, incontinentia pigmenti, etc.
- Recessive: In this type, males can be more affected than females. The affected father will transfer the specific abnormal gene to the unaffected carrier female offspring (who won’t be affected; just a carrier) while the son will be normal, but the grandson through the daughter (carrying the affected gene) will be affected. This type of inheritance is also known as crisscross inheritance. Examples of X-linked recessive infections are Fabry disease, Color blindness, etc.
Significances
- Pedigree analysis can often determine how certain traits are inherited among family members. This analysis helps identify potential risks to future offspring and the likelihood of future family members developing the disease.
- Researchers also use Genealogies to identify specific genes that cause human inherited diseases.
- The other methods, such as Punnett-square and chi-square tests, work efficiently for organisms with many offspring and controlled mating, such as in plants, but humans are different, where pedigree charts work well.
- The family size of humans is small as large families also don’t have many members.
- The mating in humans is uncontrollable (also can be heterozygous sometimes).
References
- Accessed from: https://letstalkacademy.com/pedigree-analysis/. Accessed on: 19th November, 2022.
- Vigeland M.D. (2021) Pedigree Analysis in R. 1st edition. Elsevier
- Genetic Alliance; The New York-Mid-Atlantic Consortium for Genetic and Newborn Screening Services. Understanding Genetics: A New York, Mid-Atlantic Guide for Patients and Health Professionals. Washington (DC): Genetic Alliance; 2009 Jul 8. CHAPTER 3, PEDIGREE AND FAMILY HISTORY-TAKING. Available from: https://www.ncbi.nlm.nih.gov/books/NBK115557/
- K. Ghosh, S. Shetty, in Brenner’s Encyclopedia of Genetics (Second Edition), 2013
