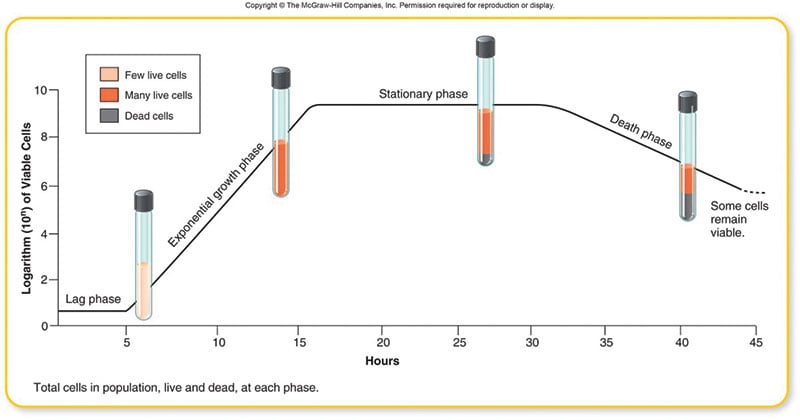
- When fresh liquid medium is inoculated with a given number of bacteria and incubated for sufficient period of time, it gives a characteristic growth pattern of bacteria.
- If the bacterial population is measured periodically and log of number of viable bacteria is plotted in a graph against time, it gives a characteristic growth curve which is known as growth curve.
- Measuring the growth rate of bacteria is a fundamental microbiological technique, and has widespread use in basic research as well as in agricultural and industrial applications.

Interesting Science Videos
Principle of Bacterial Growth Curve
When bacteria are inoculated into a liquid medium and the cell population is counted at intervals, it is possible to plot a typical bacterial growth curve that shows the growth of cells over time. It shows four distinct phases of growth.
- Lag phase: Slow growth or lack of growth due to physiological adaptation of cells to culture conditions or dilution of exoenzymes due to initial low cell densities.
- Log or exponential phase: Optimal growth rates, during which cell numbers double at discrete time intervals known as the mean generation time.
- Stationary phase: Growth (cell division) and death of cells counterbalance each other resulting in no net increase in cell numbers. The reduced growth rate is usually due to a lack of nutrients and/or a buildup of toxic waste constituents.
- Decline or death phase: Death rate exceeds growth rate resulting in a net loss of viable cells.
Turbidimetric determination is useful for plotting growth curves of bacteria in broth or liquid media. It is one of the simplest methods used to analyze trends in growth because it uses a spectrophotometer to track changes in the optical density (OD) over time. In other words, as the number of cells in a sample increase, the transmission of light through the sample will decrease.
Materials Required for Bacterial Growth Curve
Bacterial culture (E. coli), Broth (Luria Bertani (LB) Broth, Nutrient Broth)
Glass wares: Conical flasks, Measuring cylinder, Sterile test tubes, Sterile Petriplates
Reagents: Distilled water
Other requirements: Incubator, Shaker, Spectrophotometer, Micropipettes, Tips, Sterile Loops
Procedure of Bacterial Growth Curve
Day 1:
- Using sterile loop, streak a loopful of bacterial culture onto the agar plate.
- Incubate at 37oC for 18-24 hours.
Day 2:
- Pick up a single colony of each strain from the agar plate and inoculate it into a test tube containing 10 ml of autoclaved broth.
- Incubate the test tube overnight at 37oC.
Day 3:
- Take 250 ml of autoclaved broth in a sterile 500 ml conical flask.
- Inoculate 5 ml of the overnight grown culture in above flask.
- Take OD at zero hour. Incubate the flask at 37oC.
- Aliquot 1 ml of the culture suspension at an interval of every 30 minutes and take the optical density (OD) at a wavelength of 600 nm using spectrophotometer, till the reading becomes static.
Alternatively, 50-100 µl of formaldehyde can be added to all the 1 ml aliquots of culture suspension taken after every 30 minutes. Optical density of all the aliquots can be taken at the end of the experiment.
- At the end of experiment, plot a graph of time in minutes on X axis versus optical density at 600nm on Y axis to obtain a growth curve of bacteria.
Expected Result of Bacterial Growth Curve
A logarithmic growth curve is obtained showing the changes in size of a bacterial population over time in the culture. The growth curve is hyperbolic due to exponential bacterial growth pattern.
References
- http://himedialabs.com/TD/HTM001.pdf
- Maier, R.M., Pepper, I.L., and Gerba, C.P. (2000) Environmental Microbiology. Academic Press, San Diego.
- https://info.gbiosciences.com/blog/bacterial-growth-curves-turbidimetric-determination
- file:///C:/Users/I%20CAPITAL/Downloads/02Experiment_1.pdf
- http://www.onlinebiologynotes.com/bacterial-growth-curve/
- https://www.jove.com/science-education/10100/bacterial-growth-curve-analysis-and-its-environmental-applications
- https://www.encyclopedia.com/science/dictionaries-thesauruses-pictures-and-press-releases/bacterial-growth-curve
- http://science.jrank.org/pages/714/Bacteria.html
