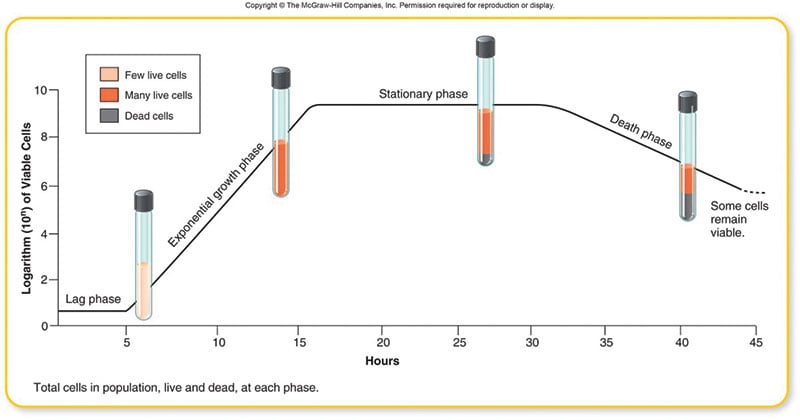
When a broth culture is inoculated with a small bacterial inoculum, the population size of the bacteria increases showing a classical pattern. When plotted on a graph, a distinct curve is obtained referred to as the bacterial growth curve.
Interesting Science Videos
Method of Obtaining Bacterial Growth Curve
- A population growth curve for any particular species of bacterium may be determined by growing a pure culture of the organism in a liquid medium at a constant temperature.
- Samples of the culture are collected at fixed intervals (e.g., every 30 minutes), and the number of viable organisms in each sample is determined.
- The data are then plotted on logarithmic graph paper.
- The logarithm of the number of bacteria per milliliter of medium is plotted against time.

The bacterial growth curve shows the following four distinct phases:
- Lag phase:
- After a liquid culture broth is inoculated, the multiplication of bacteria does not start immediately. It takes some time to multiply.
- The time between inoculation and beginning of multiplication is known as lag phase.
- In this phase, the inoculated bacteria become acclimatized to the environment, switch on various enzymes, and adjust to the environmental temperature and atmospheric conditions.
- During this phase, there is an increase in size of bacteria but no appreciable increase in number of bacterial cells. The cells are active metabolically.
- The duration of the lag phase varies with the bacterial species, nature of culture medium, incubation temperature, etc.
- It may vary from 1 hour to several days.
- Log phase:
- This phase is characterized by rapid exponential cell growth (i.e., 1 to 2 to 4 to 8 and so on).
- The bacterial population doubles during every generation. They multiply at their maximum rate.
- The bacterial cells are small and uniformly stained.
- The microbes are sensitive to adverse conditions, such as antibiotics and other antimicrobial agents.
- Growth rate is the greatest during the log phase.
- The log phase is always brief, unless the rapidly dividing culture is maintained by constant addition of nutrients and frequent removal of waste products.
- When plotted on logarithmic graph paper, the log phase appears as a steeply sloped straight line.
- Stationary phase:
- After log phase, the bacterial growth almost stops completely due to lack of essential nutrients, lack of water oxygen, change in pH of the medium, etc. and accumulation of their own toxic metabolic wastes.
- It is during this phase that the culture is at its greatest population density.
- However, Death rate of bacteria exceeds the rate of replication of bacteria.
- Endospores start forming during this stage.
- Bacteria become Gram variable and show irregular staining.
- Many bacteria start producing exotoxins.
- Decline phase:
- During this phase, the bacterial population declines due to death of cells.
- The decline phase starts due to
(a) accumulation of toxic products and autolytic enzymes and
(b) exhaustion of nutrients.
- Involution forms are common in this stage. Some cells assume various shapes, becoming long, filamentous rods or branching or globular forms that are difficult to identify.
- Some develop without a cell wall and are referred to as protoplasts, spheroplasts, or L-phase variants (L-forms).
- When these involuted forms are inoculated into a fresh nutrient medium, they usually revert to the original shape of the healthy bacteria.
Significance of the Bacterial Growth Curve
- The study of bacterial growth curves is important when aiming to utilize or inoculate known numbers of the bacterial isolate, for example to enhance plant growth, increase biodegradation of toxic organics, or produce antibiotics or other natural products at an industrial scale.
- Knowledge of bacterial growth kinetics and bacterial numbers in a culture medium is important from both a research and commercial point of view.
- Growth kinetics is also useful for assessing whether particular strains of bacteria are adapted to metabolize certain substrates, such as industrial waste or oil pollution.
- Bacteria that are genetically engineered to clean up oil spills, for example, can be grown in the presence of complex hydrocarbons to ensure that their growth would not be repressed by the toxic effects of oil.
- Similarly, the slope and shape of growth curves produced from bacteria grown with mixtures of industrial waste products can inform scientists whether the bacteria can metabolize the particular substance, and how many potential energy sources for the bacteria can be found in the waste mixture.
References
- Parija S.C. (2012). Textbook of Microbiology & Immunology.(2 ed.). India: Elsevier India.
- Engelkirk, P. G., Duben-Engelkirk, J. L., & Burton, G. R. W. (2011). Burton’s microbiology for the health sciences. Philadelphia: Wolters Kluwer Health/Lippincott Williams & Wilkins.
- Sastry A.S. & Bhat S.K. (2016). Essentials of Medical Microbiology. New Delhi : Jaypee Brothers Medical Publishers.
- Trivedi P.C., Pandey S, and Bhadauria S. (2010). Textbook of Microbiology. Pointer Publishers; First edition
- JoVE Science Education Database. Environmental Microbiology. Bacterial Growth Curve Analysis and its Environmental Applications. JoVE, Cambridge, MA, (2019).
- Kim, K. S., & Anthony, B. F. (1981). Importance of bacterial growth phase in determining minimal bactericidal concentrations of penicillin and methicillin. Antimicrobial agents and chemotherapy, 19(6), 1075-7.
