A cladogram is the graphical representation of the hypothetical relationship (phylogenetic relationship) between different groups of organisms. It is used in the phylogenetic analysis of organisms to determine the evolutionary relationship between them.
The cladogram is derived from Greek words clados and gramma where ‘clados’ means branch and ‘gramma’ means characters. It is an unscaled representation of a phylogenetic analysis where only the topography of the diagram matters. However, it doesn’t have any time axis and is instead a simple diagram that summarises a pattern of characters among different organisms. Although a cladogram includes hypothetical ancestors to derive a relationship, it is the starting point for further analysis.
Interesting Science Videos
Features of a cladogram
- The trees that result from the cladistic analysis are relative statements of relationship and do not indicate ancestors or descendants. E.g., it hypothesizes that Birds and Mammals are related but not that Mammals evolved from Birds or that Birds evolved from Mammals.
- In a cladogram, branch lengths are not proportional to the number of evolutionary changes and thus have no phylogenetic meaning.
- The external taxa of a cladogram line up neatly in a row or a column.
- Cladograms are generated by the analysis of morphological characters of the organisms and DNA or RNA sequencing data. Recently, however, computational phylogenetics is also used in the combination of the existing characters for the generation of cladograms.
- Cladograms are the assumptions for the preparation of phylogenetic trees.
- Even though cladograms are of different shapes, they all consist of lines that branch off of other lines representing the hypothetical ancestors of different organisms.
Parts of a cladogram
A cladogram is a diagram consisting of the following parts:
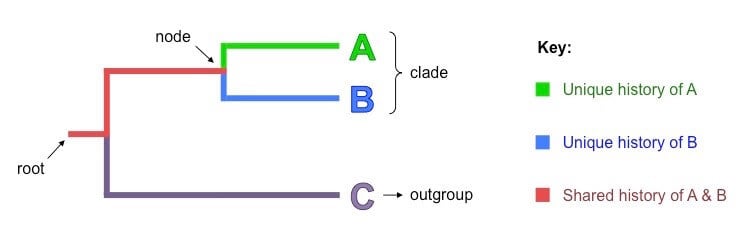
Image Source: BioNinja.
Root
- A root is the initial common ancestors of all the organisms in a cladogram.
- A root is the starting point for any given cladogram. However, the root might also indicate that it comes from some other larger clades.
Nodes
- Each node is a hypothetical ancestor that gives rise to two or more daughter taxa.
- Nodes indicate the bifurcating branch point of divergence in all cladograms.
- Thus, a node exists in each point where a group of organisms divides or separate into further different groups.
Clades
- Clades are groups of organisms or genes that include the most recent common ancestor of all of its members and all of the descendants of that most recent common ancestor.
- A clade is made up of an ancestor and all its descendants.
- It includes a particular node and all of its connected branches.
Taxon / Outgroup
- A taxon or an outgroup is the most distantly related group of animals that isn’t necessarily a clade.
- This functions as a point of reference or comparison for the rest of the cladogram.
Branches
- A branch in a cladogram is a line that connects all the other parts of the cladogram.
- The branch length in some cases represents the extent of divergence or the extent of the relationship among different taxa.
How to make a cladogram? (Constructing cladograms)
- As discussed, cladograms can be generated either based on the morphological characteristics or molecular evidence like DNA, RNA or protein sequencing.
- Therefore, on the basis of the characters used in the cladograms, these can be made in two different ways:
A. Using morphological/ structural characters
Step 1: Determine the defined characters to be used
- The first step in phylogenetic analysis is to determine whether a character is derived or primitive (innate).
- In this case, the characters that are not influenced by environmental factors are to be selected.
- The outgroup comparison method is the primary method in use for the construction of cladograms or other trees.
- In the outgroup method, a character of an organism is selected where the organisms is not a member of the group of animals to be classified, but the selected character is the same as some of the organisms in the group, then such a character can be used as a defined character.
- Here, the outside organism is called the outgroup, and the organisms being classified are the ingroup.
- Now, within the group, other characters are selected to separate the organisms in the ingroup further.
| Characters | Shark | Bullfrog | Kangaroo | Human |
| Vertebrae | X | X | X | X |
| Two pairs of limbs | X | X | X | |
| Mammary glands | X | X | ||
| Placenta | X |
- Here, the organism with the least common characters represents the outgroup. In this table above, Shark is the outgroup.
Step 2: Classify the organisms according to the shared characteristics
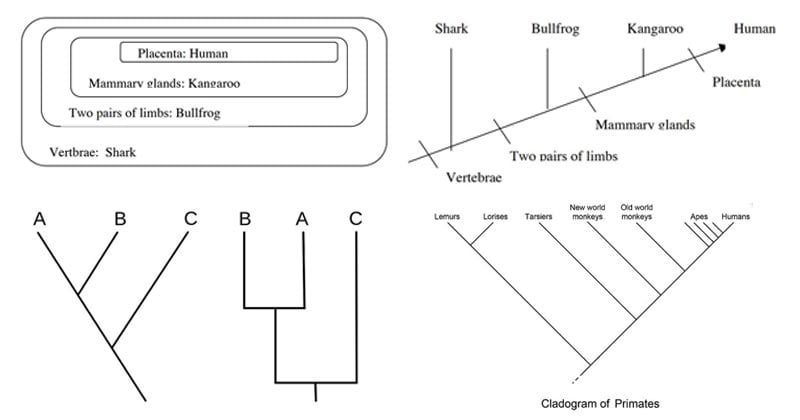
- For the grouping of the organisms, a Venn diagram can be constructed prior to developing a cladogram.
- In the Venn diagram, begin with the character that is common in all groups and place it on the outside.
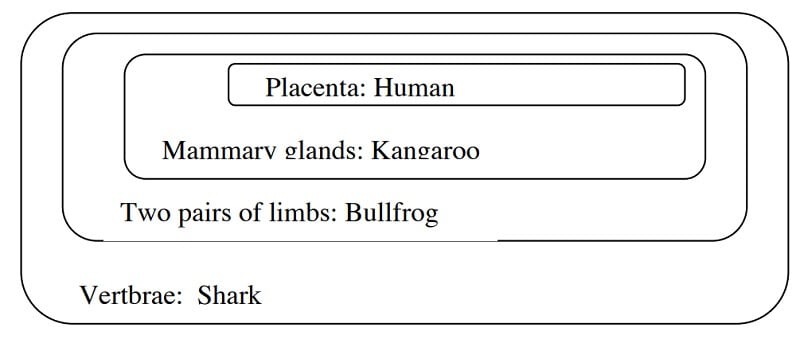
Image Source: http://www.bu.edu/gk12/eric/cladogram.pdf
- Now, convert the Venn diagram into a cladogram.
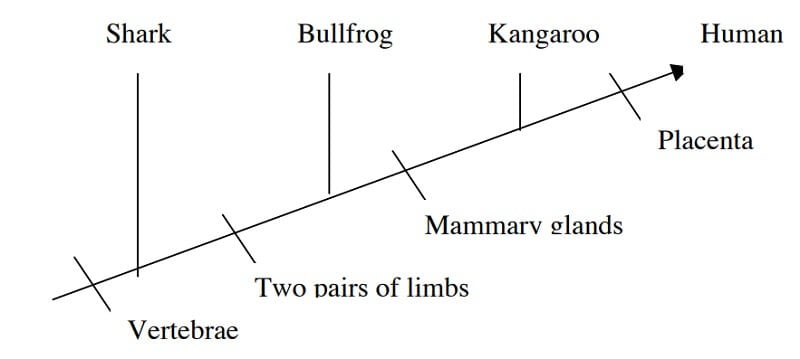
Image Source: http://www.bu.edu/gk12/eric/cladogram.pdf
B. Using molecular characters
Step 1: Selection of the molecular evidence common among the selected organisms
- The first step in phylogenetic construction using molecular evidence is to decide whether to use DNA sequences or protein sequences.
- Protein sequences are preferable in most cases.
- However, for studying very recent evolution, DNA is the marker of choice.
- Some examples of proteins that are common in many organisms are hemoglobin and cytochrome c.
Step 2: Collect and run the multiple sequence alignment to compare the molecular sequences (DNA or amino acid) for each of the organisms selected
- Multiple sequence alignment software like Clustal Omega can be used to align multiple DNA or amino acid sequences to determine similarities and dissimilarities.
- The closely related organisms will have a higher degree of similarity in the sequences compared to the organisms that are distantly related.
Step 3: Generate a cladogram from the obtained data of the multiple sequence alignment
- The next step is to select a proper substitution model that provides estimates of the relationship between the organisms by taking into account the results of multiple sequence alignment.
- The commonly used nucleotide substitution models are the Jukes-Cantor and Kimura models.
- The commonly used amino acid substitution models are the PAM and JTT models.
How to read a cladogram? (Interpreting cladograms)
- Even if a cladogram doesn’t provide a complete explanation of the relationship between different organisms, it does, however, give a basic plot in establishing a relationship.
- For the interpretation of a cladogram, let us consider the following example of a cladogram.
Image Source: http://www.bu.edu/gk12/eric/cladogram.pdf
- In the cladogram above, four phylogenetic characters are studied.
- This represents that humans and kangaroo are more closely related than humans and bullfrogs.
- The extent of the relationship cannot be determined by this cladogram as it is an unscaled diagram.
- The orientation of the lines and the order of the animals also don’t matter.
- Similarly, in the cladogram, as we move towards the right of the diagram, the organisms become less related to each other. Sharks and humans are more distantly related than bulldog and humans.
- Characteristic to all cladograms, the ancestors of the organisms are hypothetical and thus are not indicated.
- In the above diagram, the shark is the outgroup, whereas human and kangaroo form a clade.
Different styles of cladograms
- There are different styles of cladograms based on the shapes of the branches and the orientation of the branches.
- However, because a cladogram is an unscaled representation of phylogenetic analysis, the shape, length, and orientation of the branches don’t matter.
- The following are some styles of drawing cladograms:
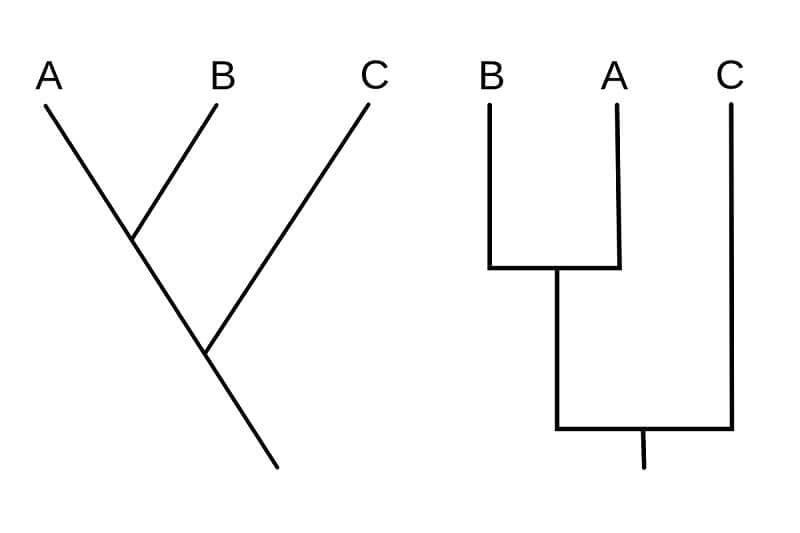
- In both of the given diagrams, two phylogenetic characters are studied and represent the same relationship between the three organisms.
Cladogram examples
- Cladograms can be used to differentiate different organisms based on some specific shared characteristics.
- The following are some examples of cladogram that can be used to distinguish organisms into further different groups based on their morphological characters:
Cladogram of primates
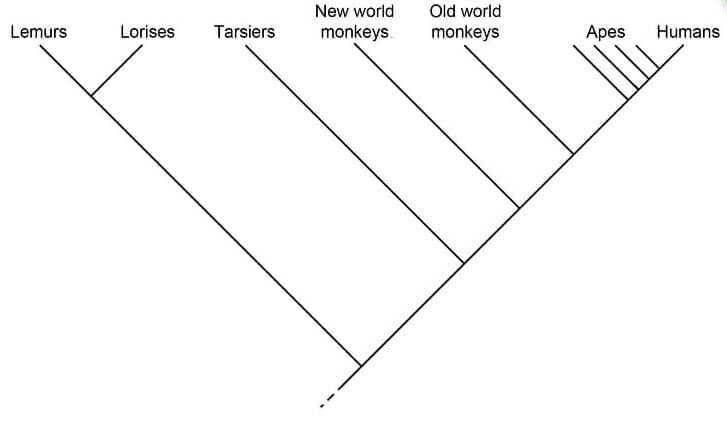
Figure: Cladogram of primates. Image Source: Biology Dictionary.
- Primates can be distinguished into separate taxa based on some specific characters.
- In the cladogram above, the branch towards lemurs and lorises is considered the outgroup while the rest are in the ingroup.
- Lemurs and Lorises also form a separate clade with a common node.
- The internal nodes present within the cladogram present hypothetical ancestors between different groups.
- Similarly, the closer the groups are to each other, the more closely related to each other they are.
Cladogram of vertebrates
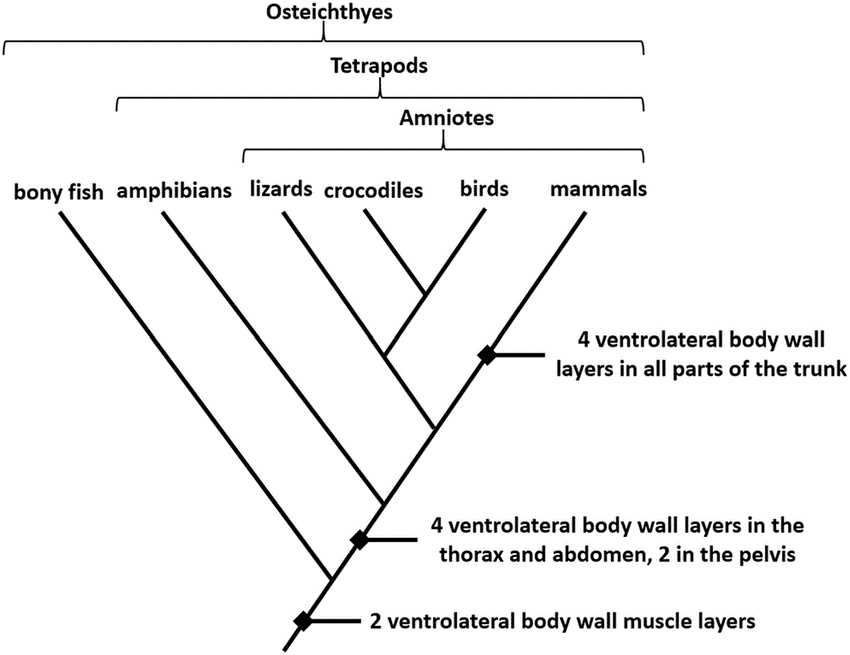
Figure: Cladogram of vertebrates.
- Vertebrates can also be further divided into groups based on various characteristics.
- Among the characters, the above cladogram represents the differentiation of vertebrates based on the ventrolateral muscle layers.
- In the given cladogram, all the groups share a common of at least two muscle layers.
- As we move further up towards the top, the taxa are separated based on the presence of four layers on the ventrolateral body wall.
- Here, the bony fish form the outgroup while the rest of the taxa are resent in the ingroup.
- Similarly, crocodiles and birds form a clade with the commonest ancestor.
- As in all other cladograms, the closer the organisms in the cladogram, the more closely related they are based on their morphological characteristics.
Cladograms Video Lecture (Bozeman Science)

Cladogram vs Phylogenetic tree (Phylogram)
- Both the cladogram and phylogenetic tree are the diagrammatic representation of phylogenetic analysis.
- Both of these provide a relationship between different groups of organisms.
- The characters used in both cladogram and phylogenetic tree are the same and involve a similar process of construction.
- However, the cladogram is often considered an initial step towards the construction of a phylogenetic tree.
Differences between a cladogram and phylogenetic tree (phylogram)
| Characteristics | Cladogram | Phylogenetic tree (phylogram) |
| Nature | Cladograms are mostly simple and can be used for the general classification of organisms. | Phylogenetic trees are more complex and are mostly used to determine the evolutionary relationship between different groups of organisms. |
| Representation | Cladograms do not represent the evolutionary relationships between different groups of the organism and thus is not an evolutionary tree. | A phylogenetic tree is an evolutionary tree that shows the evolutionary relationships between different groups of animals. |
| Use | Cladograms give a hypothetical picture of the actual evolutionary history of the organisms. | Phylogenetic trees give an actual representation of the evolutionary history of the organisms. |
| Length of the branches | All the branches in a cladogram are of equal length as they do not represent any evolutionary distance between different groups. | The branches in a phylogenetic tree usually are of different lengths as they represent the evolutionary distance between the groups. |
| Evolutionary time | The separation of the organism in a cladogram is solely based on the defined characters. Thus, the distance doesn’t indicate the evolutionary time of the groups. | A phylogenetic tree indicates the duration of evolution and the relative divergence time of the branches based on the distance between the groups. |
| Position of external taxa | The external taxa of a cladogram line up neatly in a row or a column. | The external taxa of a phylogenetic tree might or might not line up in a row or a column. |
References
- Verma HN et al. (2013). Bioinformatics. First Edition. Universal Training Solutions, Pvt. Ltd.
- Baxevanis AD and Ouellete BF (2001). Bioinformatics: A Practical Guide to the Analysis of Genes and Proteins. Second Edition. Wiley Interscience.
- Xiong J (2006). Essential Bioinformatics. First Edition. Cambridge University Press.
- Hall, Margaret & Rodriguez-Sosa, Jose & Plochocki, Jeffrey. (2017). Reorganization of mammalian body wall patterning with cloacal septation. Scientific Reports. 7. 10.1038/s41598-017-09359-y.
- https://www.differencebetween.com/difference-between-cladogram-and-vs-phylogenetic-tree/
- https://biologydictionary.net/cladogram/
- https://ib.bioninja.com.au/standard-level/topic-5-evolution-and-biodi/54-cladistics/cladograms.html
Sources
- 1% – https://www2.gwu.edu/~clade/faculty/lipscomb/Cladistics.pdf
- 1% – https://www.slideshare.net/shainamavreenvillaroza/3-schools-of-systematics
- 1% – https://wikiali.files.wordpress.com/2014/03/phylogentics.pdf
- 1% – http://www.bu.edu/gk12/eric/cladogram.pdf
- <1% – https://www.youtube.com/watch?v=OZo_fN0S9QQ
- <1% – https://www.instructables.com/id/How-to-Make-a-Cladogram/
- <1% – https://www.expasy.org/genomics/sequence_alignment
- <1% – https://www.answers.com/Q/What_do_the_location_of_derived_characters_on_a_cladogram_show
- <1% – https://wikidiff.com/phenogram/cladogram
- <1% – https://study.com/academy/lesson/cladograms-and-phylogenic-trees-evolution-classifiations.html
- <1% – https://quizlet.com/78553585/evolution-flash-cards/
- <1% – https://quizlet.com/5495071/chapter-17-birds-and-mammals-flash-cards/
- <1% – https://quizlet.com/210626616/5-evolution-biodiversity-flash-cards/
- <1% – https://en.wikipedia.org/wiki/Substitution_model
- <1% – https://en.wikipedia.org/wiki/Cladistics
- <1% – https://en.wikipedia.org/wiki/Apes
- <1% – http://spot.pcc.edu/~wdubbs/bi102/Lab%2009%20-%20Phylogeny.pdf